the Creative Commons Attribution 3.0 License.
the Creative Commons Attribution 3.0 License.
Bathymetry and oceanic flow structure at two deep passages crossing the Lomonosov Ridge
Göran Björk
Martin Jakobsson
Karen Assmann
Leif G. Andersson
Johan Nilsson
Christian Stranne
Larry Mayer
The Lomonosov Ridge represents a major topographical feature in the Arctic Ocean which has a large effect on the water circulation and the distribution of water properties. This study presents detailed bathymetric survey data along with hydrographic data at two deep passages across the ridge: a southern passage (80–81∘ N), where the ridge crest meets the Siberian continental slope, and a northern passage around 84.5∘ N. The southern channel is characterized by smooth and flat bathymetry around 1600–1700 m with a sill depth slightly shallower than 1700 m. A hydrographic section across the channel reveals an eastward flow with Amundsen Basin properties in the southern part and a westward flow of Makarov Basin properties in the northern part. The northern passage includes an approximately 72 km long and 33 km wide trough which forms an intra-basin in the Lomonosov Ridge morphology (the Oden Trough). The eastern side of the Oden Trough is enclosed by a narrow and steep ridge rising 500–600 m above a generally 1600 m deep trough bottom. The deepest passage (the sill) is 1470 m deep and located on this ridge. Hydrographic data show irregular temperature and salinity profiles indicating that water exchange occurs as midwater intrusions bringing water properties from each side of the ridge in well-defined but irregular layers. There is also morphological evidence that some rather energetic flows may occur in the vicinity of the sill. A well expressed deepening near the sill may be the result of seabed erosion by bottom currents.


The Arctic Ocean includes the northernmost loop of the global ocean circulation system. Warm water from the North Atlantic flows through Fram Strait between Svalbard and Greenland and continues into the central Arctic Ocean basin as a warm core along the northern Barents Sea shelf slope (Fig. 1). Another branch of Atlantic water flows across the Barents Sea where it undergoes significant cooling by heat loss to the atmosphere before entering the central Arctic Ocean further east in the St. Anna Trough (Schauer et al., 2002). The two branches of Atlantic inflow meet to partially mix together and continue further eastward along the continental shelf slopes of the Kara, Laptev and East Siberian seas (Rudels et al., 2000). The inflow of Atlantic water implies a net heat transport from low to high latitudes and results in the entire central Arctic Ocean basin filling up with a relatively warm (> 0 ∘C) layer at depths between about 100 and 600 m (the Atlantic water layer). The maximum temperature is located at around 200–300 m depth. Further on, the water mass definition AWL will be used for the warm core of Atlantic water (> 0 ∘C). When referring more generally to waters of Atlantic origin we use the term Atlantic water. The temperature of the Atlantic water inflow has not been steady, not even over short timescales. Several warm pulses on decadal scales have been observed, as well as sudden changes in the core temperature (Dmitrenko et al., 2009; Woodgate et al., 2001).

Figure 1(a) Map of the Arctic Ocean with the major ocean currents. Red arrows: flow of warm Atlantic water and inflow Pacific water through the Bering Strait. Purple: flow of colder Barents Sea branch of the Atlantic water inflow which has been modified when crossing the Barents Sea. Blue: flow of colder and fresher modified Atlantic water. The red and blue arrows also represent the deep water circulation below the warm core of Atlantic water. White dashed arrows: flow of low-salinity water in the surface layer and halocline. Abbreviations: Lomonosov Ridge (LR), Fram Strait (FS), Bering Strait (BS), Nansen Basin (NB), Amundsen Basin (AB), Makarov Basin (MB), and Canada Basin (CB). Yellow dots show the positions for all CTD stations during the SWERUS-C3 expedition. (b) Details of the special study area of the LR including the CTD stations. Note the position of station 148 which is referred to in the text. For further information on station numbers, see Fig. 2.
The currents in the central Arctic Ocean are generalized by a weak interior circulation and intensified boundary currents following the slopes of the shallow continental shelf seas that nearly enclose the central basin. The boundary currents carry not only the warm core of the AWL but also intermediate and deep water with lower temperatures that generally decrease with depth. The system of boundary currents containing water from the two branches of Atlantic inflow is referred to as the Arctic Circumpolar Boundary Current (Rudels et al., 1999a). However, the detailed circulation is far from one simple flow along the continental slopes of the shelves, which emerges from spatial contrasts of the Atlantic layer and deep water properties (Rudels et al., 2013). The complex seafloor landscape consists of extensive submarine ridges with morphologies that influence and steer the currents (Fig. 1).
As is the general case for the mean circulation in the weakly stratified high-latitude oceans, the circulation in the Arctic is strongly guided by bathymetry with currents tending to follow isobaths and giving rise to several internal circulation loops associated with deep sea ridges (see e.g., Nøst and Isachsen, 2003). At places where the deep sea ridges meet the continental slope they may deflect a part of the boundary current from the continental slope and make it follow the ridge instead. The largest deep sea ridge system in the Arctic Ocean is the Lomonosov Ridge (LR) rising up several thousand meters above the abyssal plains and stretching all the way from the Siberian slope to the continental slope north of Greenland (Fig. 1). The LR also defines the border between the two major ocean basins in the Arctic: the Eurasian Basin, with sub-basins Nansen Basin and Amundsen Basin, and the Amerasian Basin, with sub-basins Makarov Basin and Canada Basin. The impact of the LR as a major obstacle for the boundary current's passage along the Siberian slope from the Eurasian Basin to the Amerasian Basin side is clearly seen in hydrographic data (Anderson et al., 1994), current measurements (Woodgate et al., 2001) and ocean modeling studies (Aksenov et al., 2011). The boundary current splits up into two branches where the LR meets the Siberian shelf slope (Fig. 1). One branch turns north and flows along the ridge towards Greenland and one part passes the ridge and continues along the shelf slope in the Amerasian Basin. In addition to the passage of warm Atlantic water flowing across the LR from the Amundsen Basin to the Makarov Basin, there is also evidence based on mooring data that deep water from the Makarov Basin passes the ridge in the opposite direction in this area (Woodgate et al., 2001).
Mapping the detailed pathways of the warmer water of Atlantic origin is of importance as the heat it brings influences the Arctic Ocean environment, specifically the marine cryosphere, including for example gas hydrates stored in bottom sediments, sea ice and outlet glaciers. More specifically, the inflowing warm Atlantic water controls the temperature near the seabed along the continental shelf slope, which affects the location of the gas hydrate stability zone and thus impacts the storage and release of methane (Biastoch et al., 2011; Stranne et al., 2016; Westbrook et al., 2009). Furthermore, the heat carried with the inflow has a large potential to melt the perennial sea ice cover (Polyakov et al., 2010), although mostly in areas with weak salinity stratification such as north of Svalbard. In most parts of the Arctic, the AWL is shielded from the sea ice by a strong cold halocline resulting from freshwater supply by rivers and low-salinity water coming from the north Pacific through the Bering Strait (Sirevaag and Fer, 2009; Linders and Björk, 2013). Another example illustrating the complex pathways of Atlantic water is that it finds its way across Lincoln Sea to reach the Petermann Fjord of northwestern Greenland where the heat it brings causes melting of the underside of Petermann Glacier's floating ice tongue (Münchow et al., 2007).
In a larger context, it is clear that the LR plays a critical role not only by shaping the property distribution of the intermediate and deep waters among the major Arctic Ocean basins but also by controlling the mixing and water mass transformation from the inflowing Atlantic water contained in the two branches to the outflow of colder and fresher modified water through the western Fram Strait (Rudels et al., 1999a). This outflow then contributes to the overflow across the Greenland–Scotland ridge and the North Atlantic Deep Water formation.
The bathymetric portrayal of the LR in the latest version 3.0 of the International Bathymetric Chart of the Arctic Ocean (IBCAO) is mainly based on sparse single beam echo soundings from icebreakers, submarines and digitized depth contours from published maps, apart from a few areas mapped by multibeam echo sounder (Jakobsson et al., 2012). The sparse source data implies that bathymetric details of importance from an oceanographic perspective may be missed in some areas, such as the location of bathymetric passages or saddles in the LR, which are critical as this is where a large part of the water exchange between the basins can occur. The (presumably) deepest passage across the LR, with a sill depth of 1870 m, is located at 88∘ N. This passage was mapped in detail with multibeam observations together with hydrographic observations in 2005 and it was shown that a substantial flow of Canadian Basin Deep Water passes through it (Björk et al., 2007, 2010).
Here we present a detailed bathymetry of two other deep passages in the LR morphology together with hydrographic data acquired during the SWERUS-C3 (Swedish-Russian-US Arctic Ocean Investigation of Climate-Cryosphere-Carbon Interactions) expedition in 2014 with the Swedish icebreaker (IB) Oden. The southernmost of these passages is located close to the Siberian shelf slope between about 80 and 81∘ N, where it can be expected that most of the Atlantic water passes the LR towards the Amerasian Basin. The other passage is located further north at ∼ 85∘ N in an area that has not been studied before but has been suggested as a possible location for exchange of Atlantic water (Woodgate et al., 2001). Our study shows the critical importance of knowing the detailed shape of the seafloor in order to map the deep currents, which in the Arctic Ocean are critical for the distribution of heat and other properties and have implications for the marine environment, including the vulnerable marine cryosphere.
The entire water sampling program during the SWERUS-C3 expedition took place between 15 August and 25 September 2014. Collection of water samples from the southern LR area, in focus here, was performed between 14 and 22 September. A rosette equipped with 24 Niskin bottles was used for the water sampling. CTD (conductivity, temperature, depth) observations were made using a SeaBird 911 CTD equipped with dual SeaBird temperature (SBE 3), conductivity (SBE 04C) and oxygen sensors (SBE 43). Salinity samples were analyzed using a Autosal salinometer (Guildline Instruments), which was kept in a well-isolated lab container in order to keep the temperature as constant as possible. The salinometer was calibrated using one standard sea water ampule (IAPSO standard sea water from OSIL Environmental Instruments and Systems) before each batch of 24 samples. The CTD data files were post-processed with standard SeaBird data processing software. Removal of spikes in the CTD data was done manually by first visually identifying spikes and then interpolating across the spike in the file with full time resolution. The alignment parameter was tuned for each sensor pack following the suggested method described in the SeaBird data processing manual. Salinities were compared with bottle salinities analyzed with the Autosal lab salinometer. This analysis revealed a systematic offset of conductivity sensor 1, from station 16 and onward, corresponding to about 0.002 psu higher salinities compared to the salinometer and to conductivity sensor 2. A conductivity slope correction was calculated and the raw data conversion was redone with the slope correction. Water column data are mainly analyzed using the potential temperature θ (∘C), salinity S (psu) and dissolved oxygen O2 (µmol kg−1)
We also make use of bottle data of oxygen and silicate sampled from the rosette. Dissolved silicate was measured on board using a continuous flow analyzer (QuAAtro system, Seal Analytical). Within each analysis run, a calibration was done using a commercial stable silica-compound solution. Analysis quality was further assured by automatic drift control using standard solutions, with the precision being 1.3 % based on 28 determinations of standards. An automated Winkler titration system was used for the oxygen measurements with a precision of 1 µmol kg−1. The accuracy was set by titrating known amounts of KIO3 salts that were dissolved in sulfuric acid. As the amount was known to better than 0.1 %, the accuracy should be significantly less than the precision.
A description of the geophysical mapping program onboard IB Oden during the SWERUS-C3 2014 expedition is included in Jakobsson et al. (2016). Here we provide a methods summary with emphasis on the mapping of the areas of the LR that are the focus of this study. Multibeam swath bathymetry was acquired using the Kongsberg EM 122 (12 kHz, 1∘ × 1∘) multibeam system installed in IB Oden. The CTD observations gathered for the oceanographic program were used for sound velocity control and supplemented with XBT (expendable bathythermograph) casts. The target areas of the LR were bathymetrically mapped with between 50 and 100 % overlapping multibeam swaths to acquire high-quality imagery of the ridge morphology. All multibeam bathymetric data were processed using a combination of the software CARIS and Fledermaus-QPS. Grids with horizontal resolutions ranging between 15 m × 15 m and 30 m × 30 m were produced and used for the final analyzes in the 3-D environment of Fledermaus and in the GIS software ArcMap. In addition to multibeam bathymetry, sub-bottom profiles were collected using the Kongsberg SBP 120 3∘ × 3∘ chirp sonar installed in IB Oden. The chirp sonar was operated continuously using a 2.5–7.0 kHz pulse.
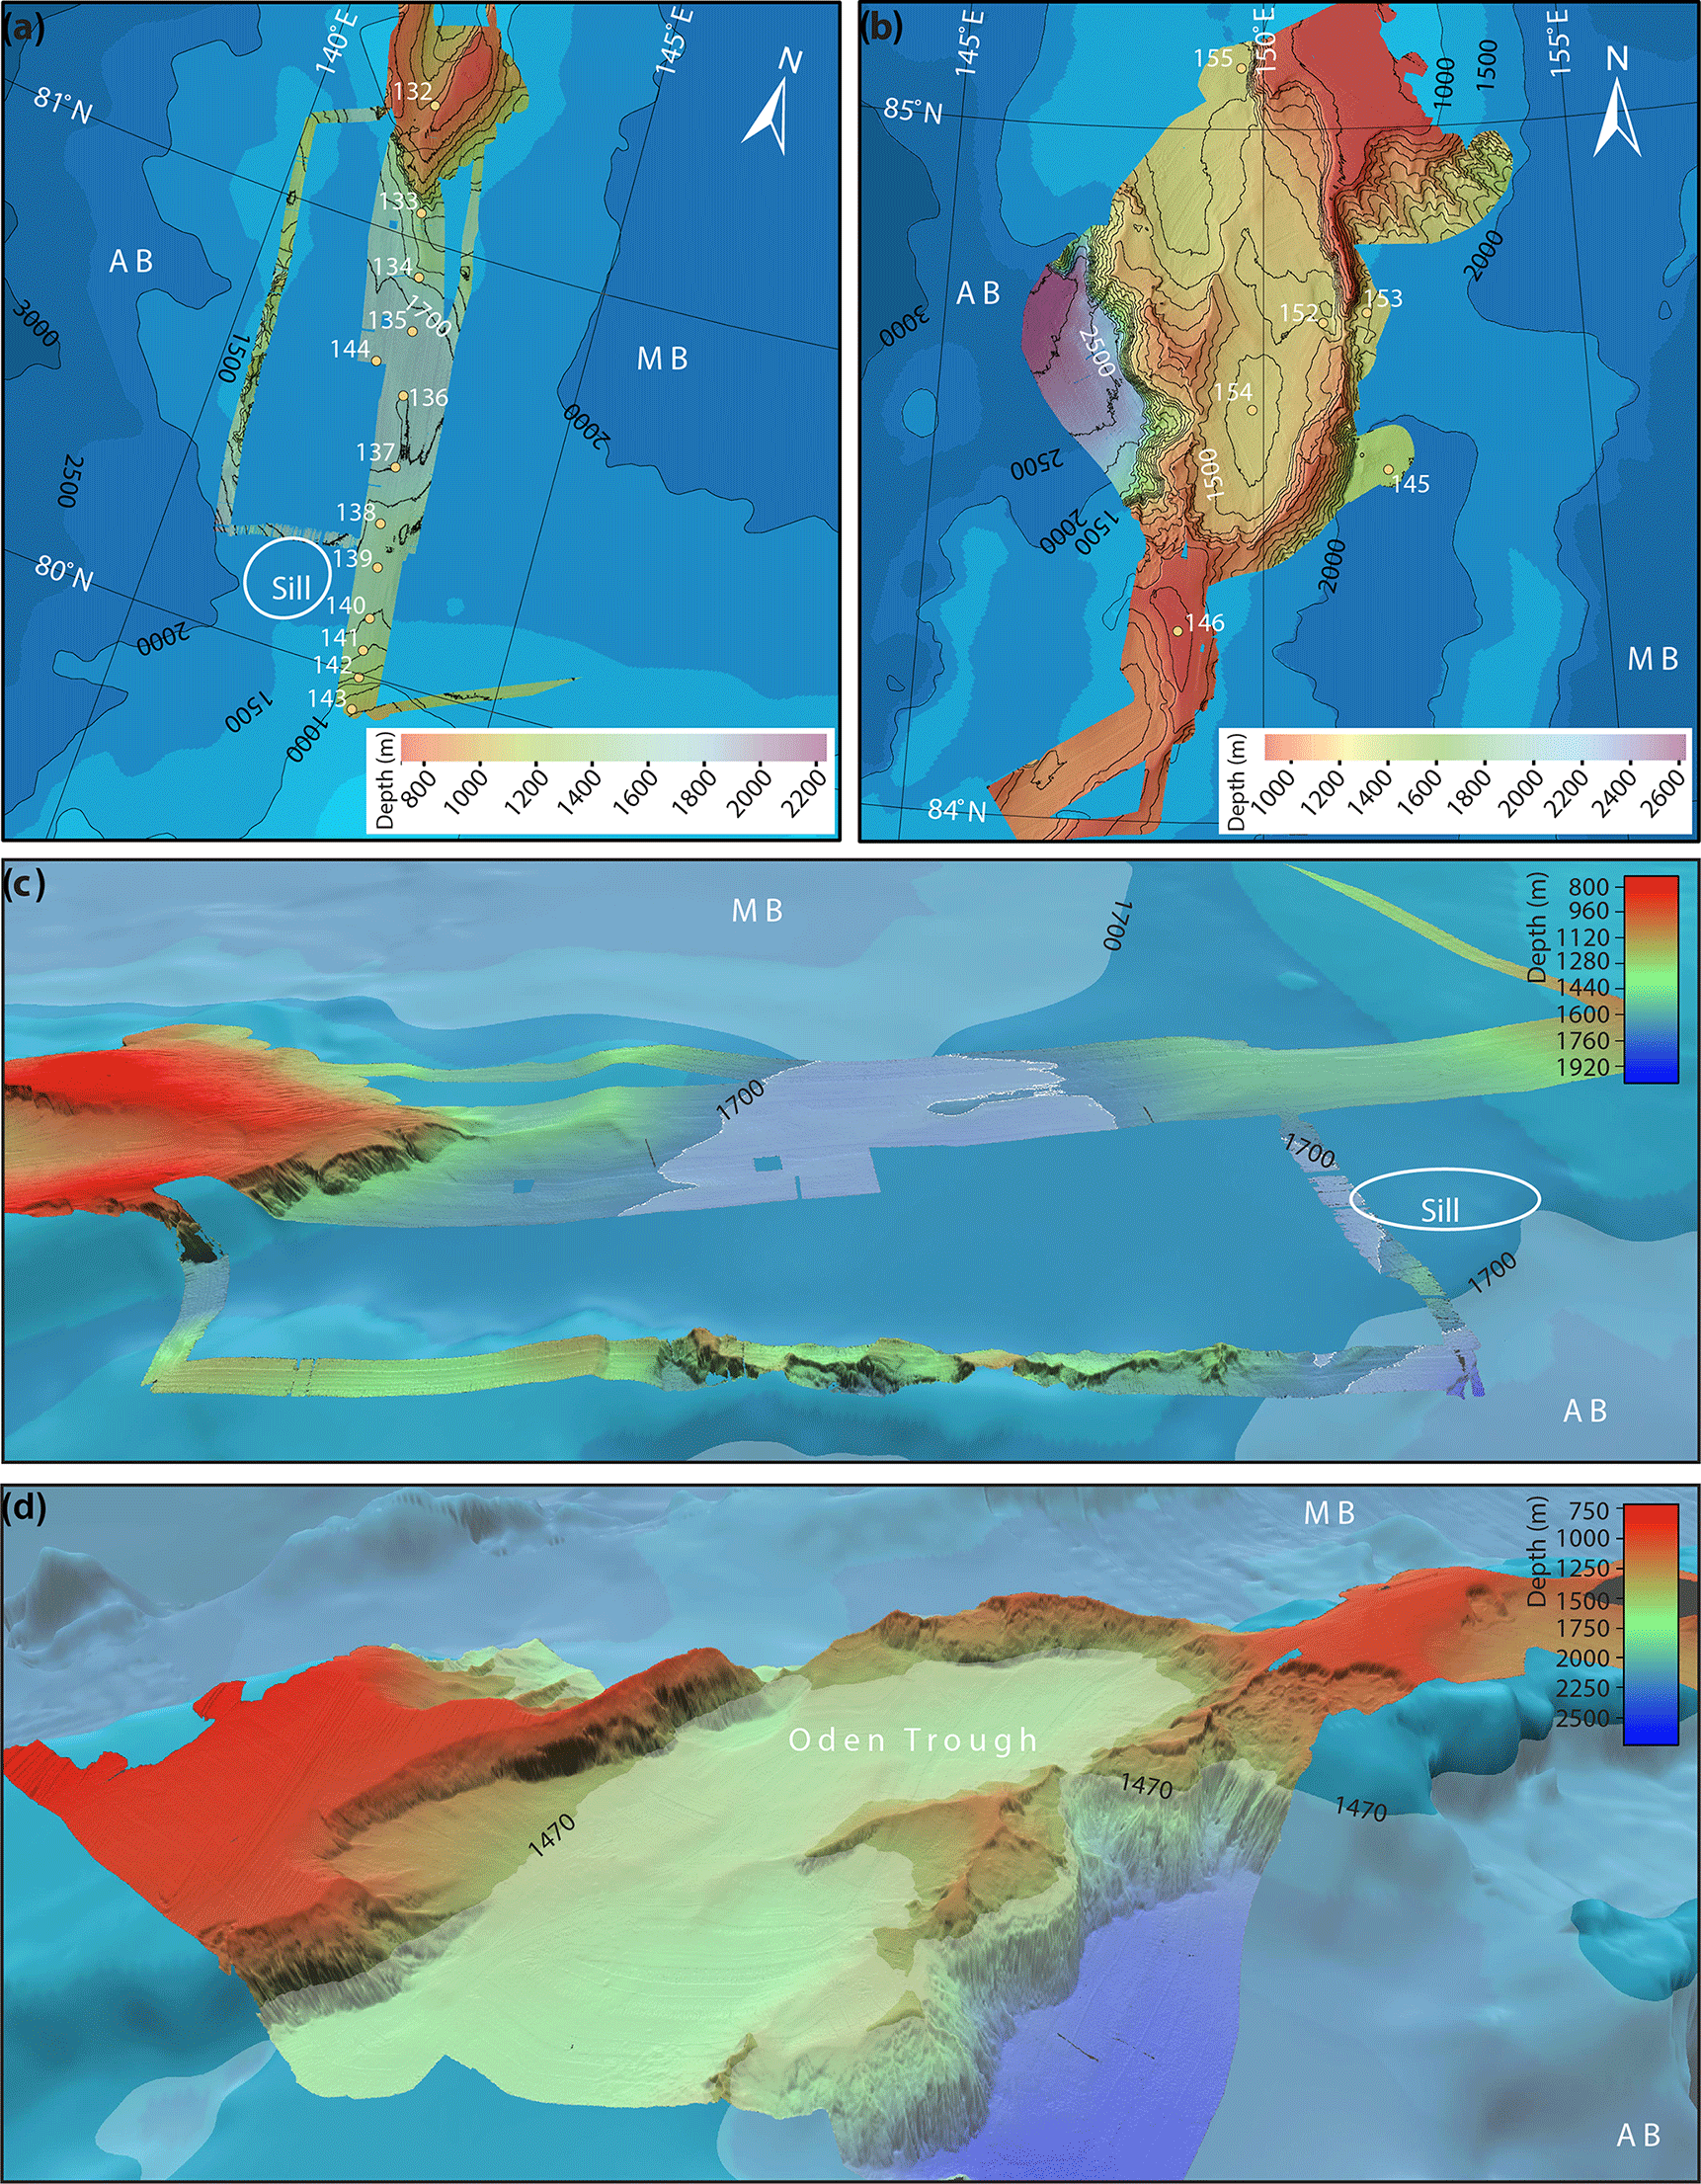
Figure 2Detailed maps of the southern passage (a, c) and northern passage (b, d). The likely position of the sill for the southern passage is within the white circle. A semitransparent plane visualize the approximate sill level of 1700 m for the southern passage (c) and the actual sill level of 1470 m for the northern passage (d).
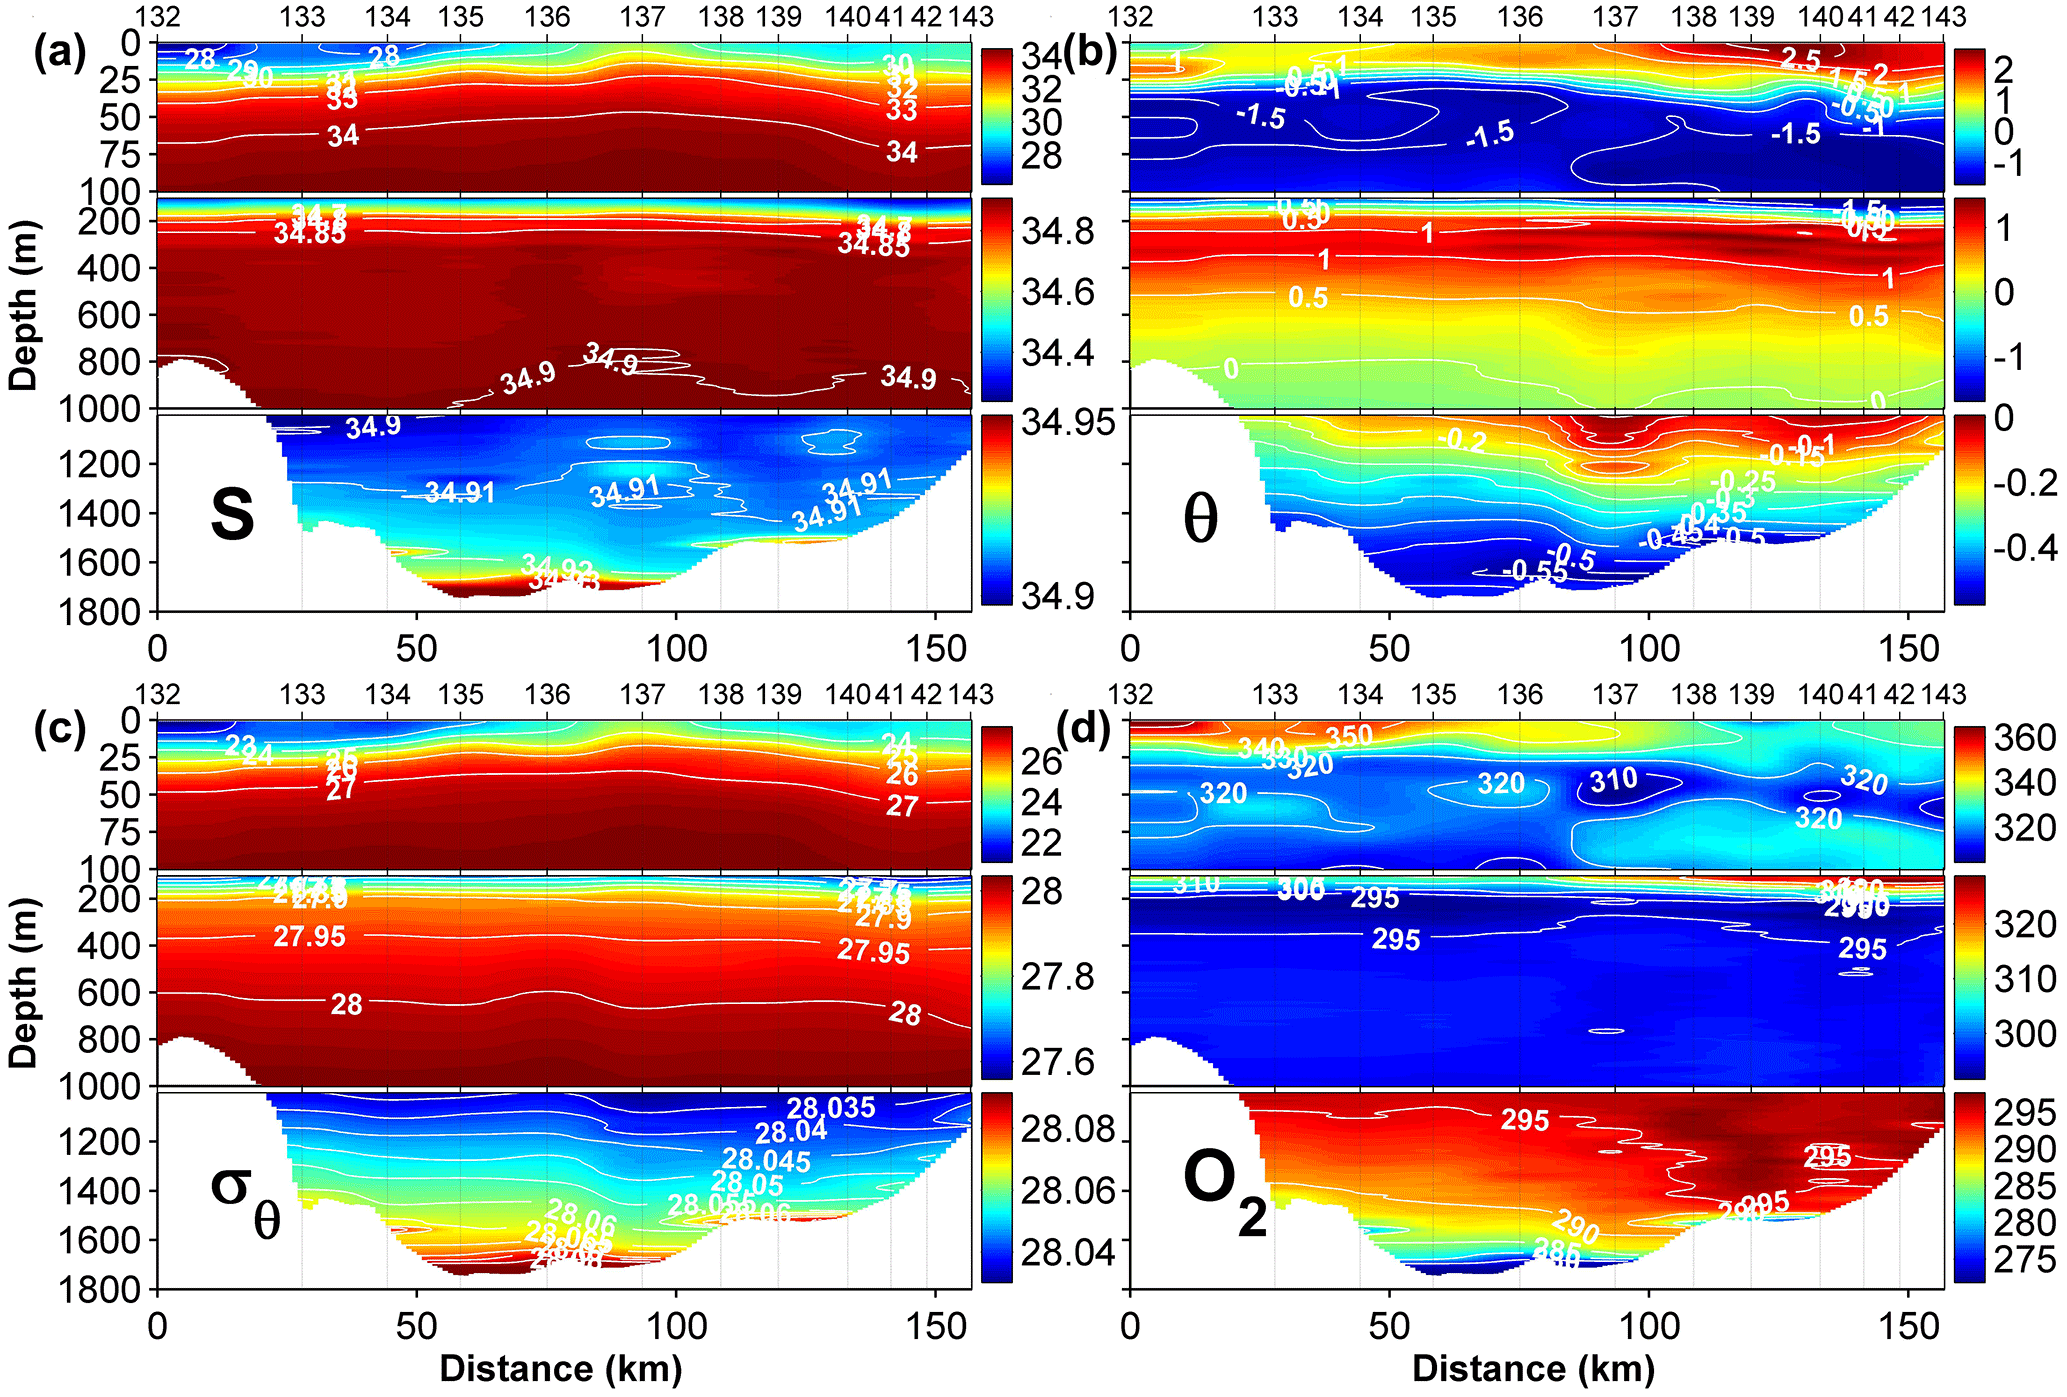
Figure 3Sections across the southern passage showing (a) salinity S (psu), (b) potential temperature θ (∘C), (c) potential density σθ (kg m−3) and (d) dissolved oxygen O2 (µmol kg−1). Please note the different color scales for the separate depth intervals. Note also that stations 141 and 142 are labeled as 41 and 42 in order to save space.
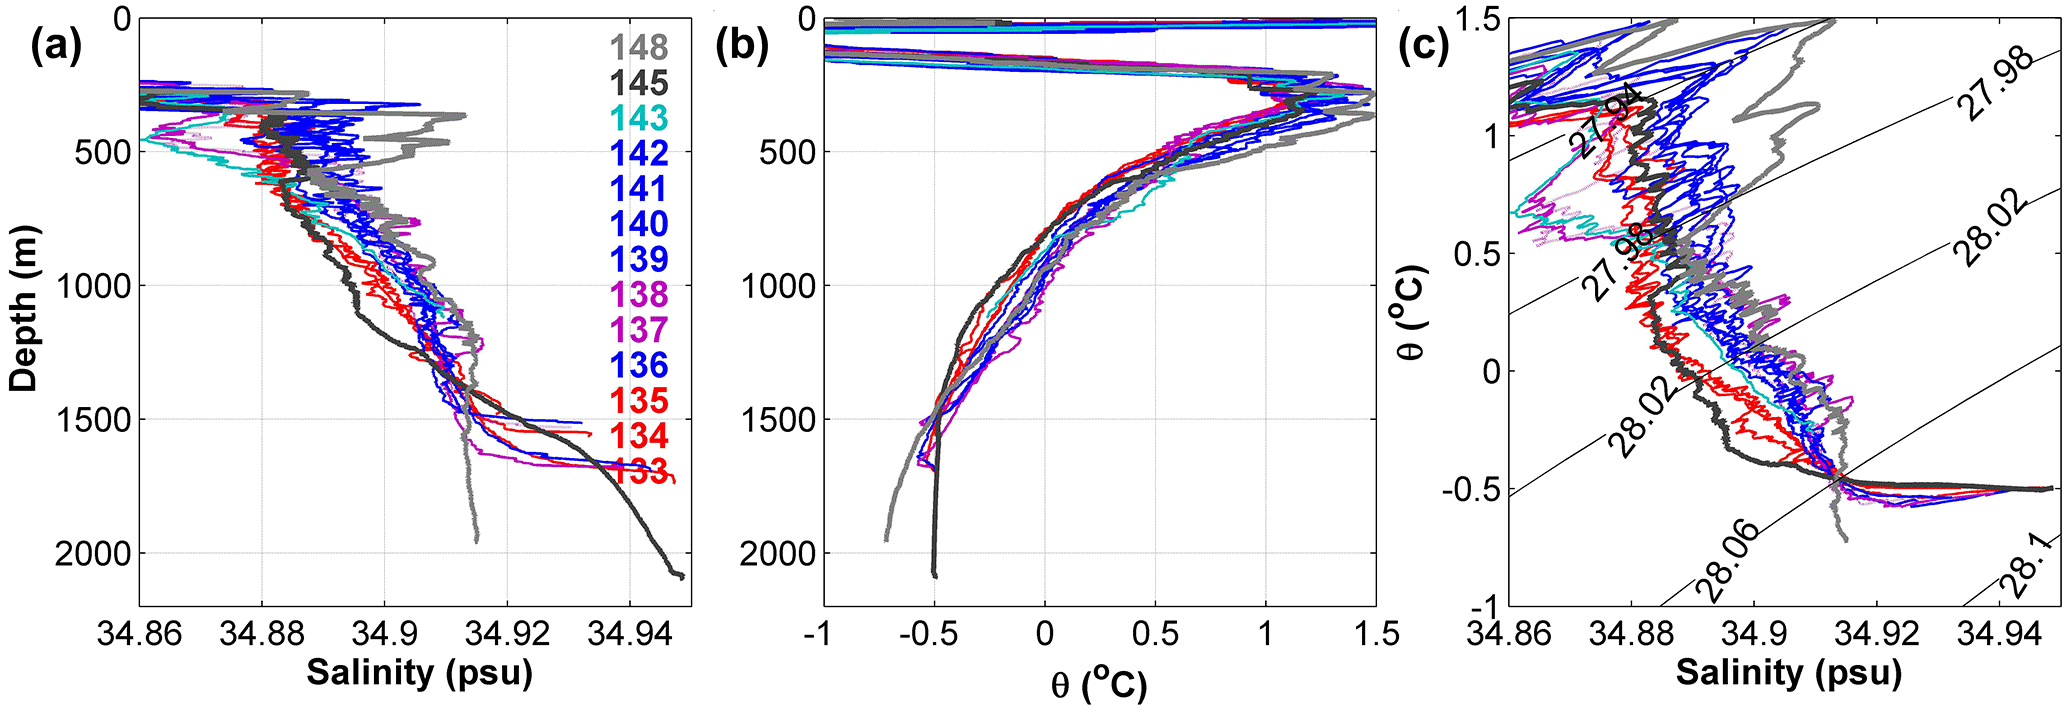
Figure 4Salinity and potential temperature (θ) profiles in the southern passage. The bold profiles show reference stations in the Makarov Basin (station 145; black) and Amundsen Basin (station 148; gray). Blue, magenta and cyan profiles are those at the southern part of the section and the three northernmost are red. For positions of the stations, please refer to Figs. 1 and 2.
The high quality of the bathymetric data collected was due, in large part, to the exceptionally ice free conditions along the LR during summer 2014. The northern section of the LR shown in Fig. 2b was the last area to be investigated in detail during the SWERUS-C3 2014 expedition. The limited time available before IB Oden had to begin the return transit implied that all oceanographic stations were carried out concurrently with the multibeam mapping program. This excluded the possibility to strategically place hydrographic stations along section lines based on a detailed bathymetry map of the area.
3.1 Southern passage
The LR meets the continental slope of the Siberian shelf approximately at the defined border between the Laptev and East Siberian seas (Fig. 1). This section of the LR, here referred to as the southern passage, is characterized by smooth and flat bathymetry with depths around 1600–1700 m in the deeper central parts where the hydrographic section is located (Fig. 2a, c). North of the deepest flat part, the ridge rises rather abruptly to reach depths shallower than 800 m. The southern end of the southern passage is confined by the continental slope that rises to the continental shelf. The single multibeam track on the western side of the surveyed section reveals a stripe of rugged bottom topography with generally shallower depths than in the central parts, undulating roughly between 1300 and 1500 m. Increasing depths at the southern end of this western section suggest that the bathymetric sill of the southern gap is likely located at the southwestern rim of the central plateau. However, since the southern passage in the LR was not completely covered by the SWERUS-C3 multibeam survey, it is not possible to exactly pinpoint the location of the sill. We cannot exclude that there might be a shallower area forming a sill, where there is no multibeam coverage between the hydrographic section and the western single track of multibeam data. However, the multibeam data we have at hand together with the general morphology of the LR provided by Version 3.0 of IBCAO, suggest a sill shallower than 1700 m somewhere south of 81∘15′ N, 141∘30′ E (Fig. 2a). IBCAO is generally in good agreement with the newly acquired multibeam bathymetry, but approximately 50 m shallower in the deeper parts of the southern passage than our new multibeam bathymetry. IBCAO Version 3.0 is in this area primarily based on digitized contours from the Russian bottom relief map of the Arctic Ocean (Naryshkin, 2001), which do not include information on the bathymetric source data used. Overall, the new multibeam bathymetry from SWERUS-C3 together with depth information from IBCAO 3.0 provides a spatial context for the north–south hydrographic section across the southern passage (along the ridge crest) close to the Siberian continental slope (Fig. 3).
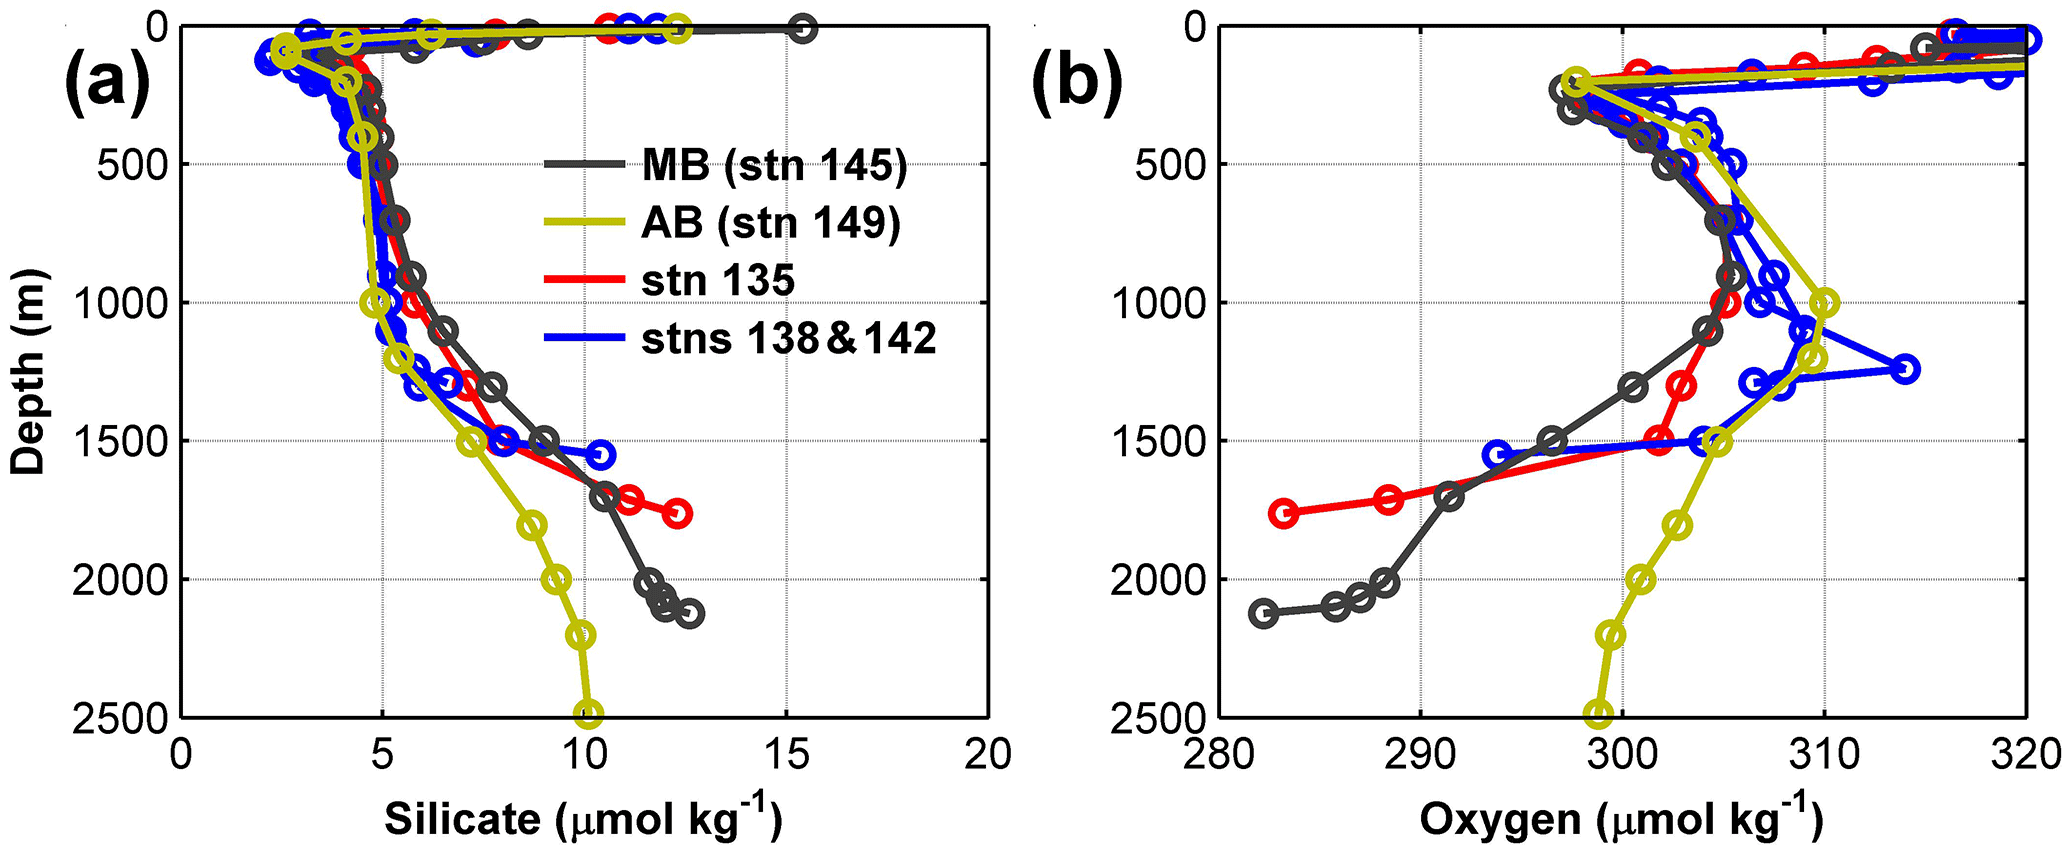
Figure 5Silicate (a) and dissolved oxygen (b) from bottle data (circles show sampling depth) in the southern passage (stns. 135, 138 and 142) compared with reference stations in the Makarov Basin (MB) and Amundsen Basin (AB). For positions of the stations, please refer to Figs. 1 and 2. Station 149 is located in the westward direction next to station 148 as shown in Fig. 1b.
The section across the southern passage shows a low-salinity surface layer down to about 20 m with high temperatures (up to 3 ∘C) above a cold layer close to the freezing point (Fig. 3). The low salinity is a result of ice melting, as well as fresh water input from the north Siberian rivers. The high surface temperature is a result of the open water conditions which allowed for supplying of heat by absorption of solar radiation and air–sea heat exchange during the summer. The interval between about 100 and 900 m contains the AWL with temperatures above 0 ∘C. The highest temperature in the AWL is above 1.5 ∘C and is seen in the southern half of the section, indicating that Atlantic water from the Amundsen Basin passes the ridge through this channel with a high-temperature/salinity core in the southern part. The deep waters (> 1000 m) are characterized by decreasing temperatures and increasing salinity towards the bottom. The deepest part of the section shows deviating properties in a thin bottom layer with significantly higher salinity, while the temperature deviation is less pronounced. The density (Fig. 3c) is also higher in this layer. Another noteworthy feature is at station 137 with higher temperature and salinity at mid-depth in the range 600–1300 m. There are also cores with lower salinity in the AWL around 450 m as seen in profiles from stations 137 and 138, as well as at the southernmost station 143. These are barely visible in the section plots but stand out in the θ–S profiles (Fig. 4). The oxygen section (Fig. 3d) shows generally high concentrations in the surface layer roughly matching the salinity distribution. It is relatively constant in most of the depth interval 200–1000 m with a concentration around 295 µmol kg−1. The deepest part shows lower oxygen concentrations at the northern stations below 1200 m. The concentration is also significantly lower in the thin bottom layer.
Vertical profiles of θ and S collected in the southern passage are compared with reference stations in the Makarov Basin (stn. 145) and Amundsen Basin (stn. 148) in Fig. 4. The reference stations were chosen in order to represent the water properties, at each side of the ridge, away from the passages. We focus first on the observed properties above the thin bottom layer. In the depth interval 700–1300 m, it can be seen that the depth profiles of the three northernmost stations are shifted towards the Makarov Basin reference profile, while the other stations are shifted towards the Amundsen Basin reference profile. This difference is seen even clearer in the θ–S plot (Fig. 4c). The situation is more complicated in the AWL (300–700 m), because of the isolated core feature at stations 137 and 138 with significantly lower salinity and slightly colder temperatures. Also, the southernmost station (stn. 143) has a similar pattern to the AWL. Apart from these special features, it is clear that the Makarov Basin properties dominate the three northern stations above a depth of about 1300 m and well into the AWL. This is also seen in the oxygen section data with lower concentrations at depth in the northern part of the section indicating a flow from the Makarov Basin having generally lower oxygen concentration in this depth interval (see also Fig. 5). The observed profiles along the section thus suggest a flow from the Makarov Basin to the Amundsen Basin in the north and a flow from the Amundsen Basin to the Makarov Basin over the major southern part of the channel, in the depth interval 400–1300 m.
A possible explanation of the special features at station 137 and 138 is that they are formed between the warmer and saltier Fram Strait branch of the Atlantic inflow and fresher and colder Barents Sea branch. The differences in θ–S properties result in highly variable vertical structures at the confluence when these two water masses meet east of the St. Anna Trough. The structures are formed by interleaving motions bringing layers of each water mass in under and above each other, or by isolated parcels/eddies of Barents Sea branch water which are brought into the Fram Strait branch and vice versa (Rudels et al., 2000). The water from the two branches then moves together in the boundary current along the Laptev Sea slope, with the Barents Sea branch closest to the continental slope. Evidence of interleaving/eddy structures are also seen downstream at large distances from the confluence area, indicating that these are carried with the flow while diminishing in amplitude due to mixing processes (Rudels et al., 2000). These structures will likely also exist at the southern section where some part of the boundary current passes the LR, as seen at stations 137 and 138.

Figure 6Historical water mass distributions across the Lomonosov Ridge. Potential temperature θ and salinity profiles and potential temperature–salinity plots for two sections taken at 81∘ N in 1995 (a, c, e, g) and 1996 (b, d, f, h). The black and gray profiles mark the SWERUS-C3 reference stations for the Makarov (stn. 145) and Amundsen basins (stn. 148), respectively. The historical stations are color-coded according to longitude and water mass characteristics and are marked in the same color in the maps in panels (a) and (b). Black dots show the SWERUS-C3 stations.
The deviating properties near the bottom are clearly seen in the vertical profiles below 1500 m. The salinity and temperature increases sharply in a bottom layer of about 50 m thickness. The salinity anomalies in this layer are typically 0.02 psu, while the temperature is higher by about 0.05 ∘C at the deepest three stations. The salinity anomaly dominates the density resulting in enhanced potential density (Fig. 2c). This bottom layer is likely associated with the bowl shape of the central plateau and we surmise that this is water that has become trapped in the depression. This appears clear for the deepest part below 1700 m, but is not so obvious for the shallower signals at stations 134 and 138–140, which lie at about 1500 m and are thus well above the sill depth of the local depression. The properties near the bottom are similar to Makarov Basin properties, but the salinity is higher than the reference profile. The salinity and density match the Makarov Basin profiles 400 m deeper for the deepest stations along the section and about 200 m deeper for the shallower stations. The bottom layer also has anomalous concentrations of chemical constituents with significantly higher silicate concentrations and lower oxygen concentrations near the bottom (Fig. 5). These values also match the Makarov Basin properties 200–400 m deeper down. This suggests that Makarov Basin water has been uplifted 200–400 m and filled up a bottom layer with relatively deep Makarov Basin characteristics across the high plateau of the passage. Evidence that such vertical motions actually occur can be found from deep sea mooring data nearby in the Makarov Basin. The salinity data from a moored instrument at 1700 m depth during 1995–1996 (Woodgate et al., 2001) show relatively large salinity variability, both short and long term, of about 0.02 psu, which is likely associated with vertical motions in combination with a vertical property gradient. The bottom-layer water characteristics can thus be explained by upward displacement of water from deeper levels in the Makarov Basin that subsequently have become trapped on the plateau. However, the small vertical extent and sharp halocline at the top of the layer is still puzzling. It indicates that the structure was formed relatively recently since vertical turbulent diffusion would smear it out relatively quickly. Using a value of 5 × 10⁻⁵ m2 s−1 for the turbulent diffusion coefficient according to observations at the LR (Rainville and Winsor, 2008), it would take about 1 year to reduce the maximal vertical salinity gradient by 50 %. The layer is also located at a shallower depth at the northern and southern stations, which indicates that it contributes to cross-ridge flows giving rise to sloping isopycnals.
Additional evidence of water mass transport from the Makarov to the Amundsen Basin at the northern end of the southern gap is found in two zonal sections at 81∘ N acquired by RV Polarstern expeditions ARK-XI/1 and ARK-XII in 1995 and 1996, respectively. The 1995 section was acquired on 20–27 August and the 1996 section on 16–20 August. They coincide with the northern end of the SWERUS-C3 section and include deep stations in both basins. This implies that they may serve as reference stations representative for each year to exclude interannual variability and long-term trends that have been identified in the Arctic (Polyakov et al., 2012). Both in 1995 and 1996, the AWL is around 0.03 psu fresher, but have a similar core temperature as SWERUS-C3 data from 2014 (Fig. 6c–f). In 1995, there is a salinity minimum between 500 and 700 m (Fig. 6c and g), originating from the Barents Sea branch inflow (Schauer et al., 2002). In the 1995 section, both S and θ between 400–1000 m depth show remarkably little difference west and east of the ridge. The profiles start to divide between the Makarov and Amundsen Basin properties below 1200 m with the three easternmost profiles (red) being warmer and saltier than the westernmost ones. There is, however, signs of Makarov Basin water at the western side of the ridge in one of the blue profiles between 1100 and 1700 m and also in a relatively thin bottom layer with higher salinity below 1700 m (light blue). In 1996, all but the westernmost station along 81∘ N (Fig. 6b, d and h; blue) show fresher Makarov Basin water in the depth interval 500–1500 m, as referenced by the two easternmost stations (Fig. 6b, d and h; red). The absence of a Makarov Basin hydrographic signature at the westernmost station indicates that the Makarov Basin waters are deflected along the steep topography on the western side of the LR. Data from both years show evidence of a thin, salty bottom layer at the western side of the ridge (light blue stations 1995 and magenta 1996). This suggests that the thin, salty bottom layer we observed in the SWERUS-C3 data is not an isolated phenomenon in time and that the Makarov Basin deep water that has been uplifted onto the ridge may spread westwards across the rugged western edge of the bowl in the southern passage.
Both the SWERUS-C3 data and historical sections thus show signals of a flow of Makarov Basin water towards the Amundsen Basin crossing the LR through the southern passage. This type of flow was also inferred from mooring data in 1995–1996 showing clear signals of Makarov Basin water at a mooring site (located at 81∘34.5′ N, 138∘54.0′ E) at the western flank of the LR and just north of the southern passage (Woodgate et al., 2001).
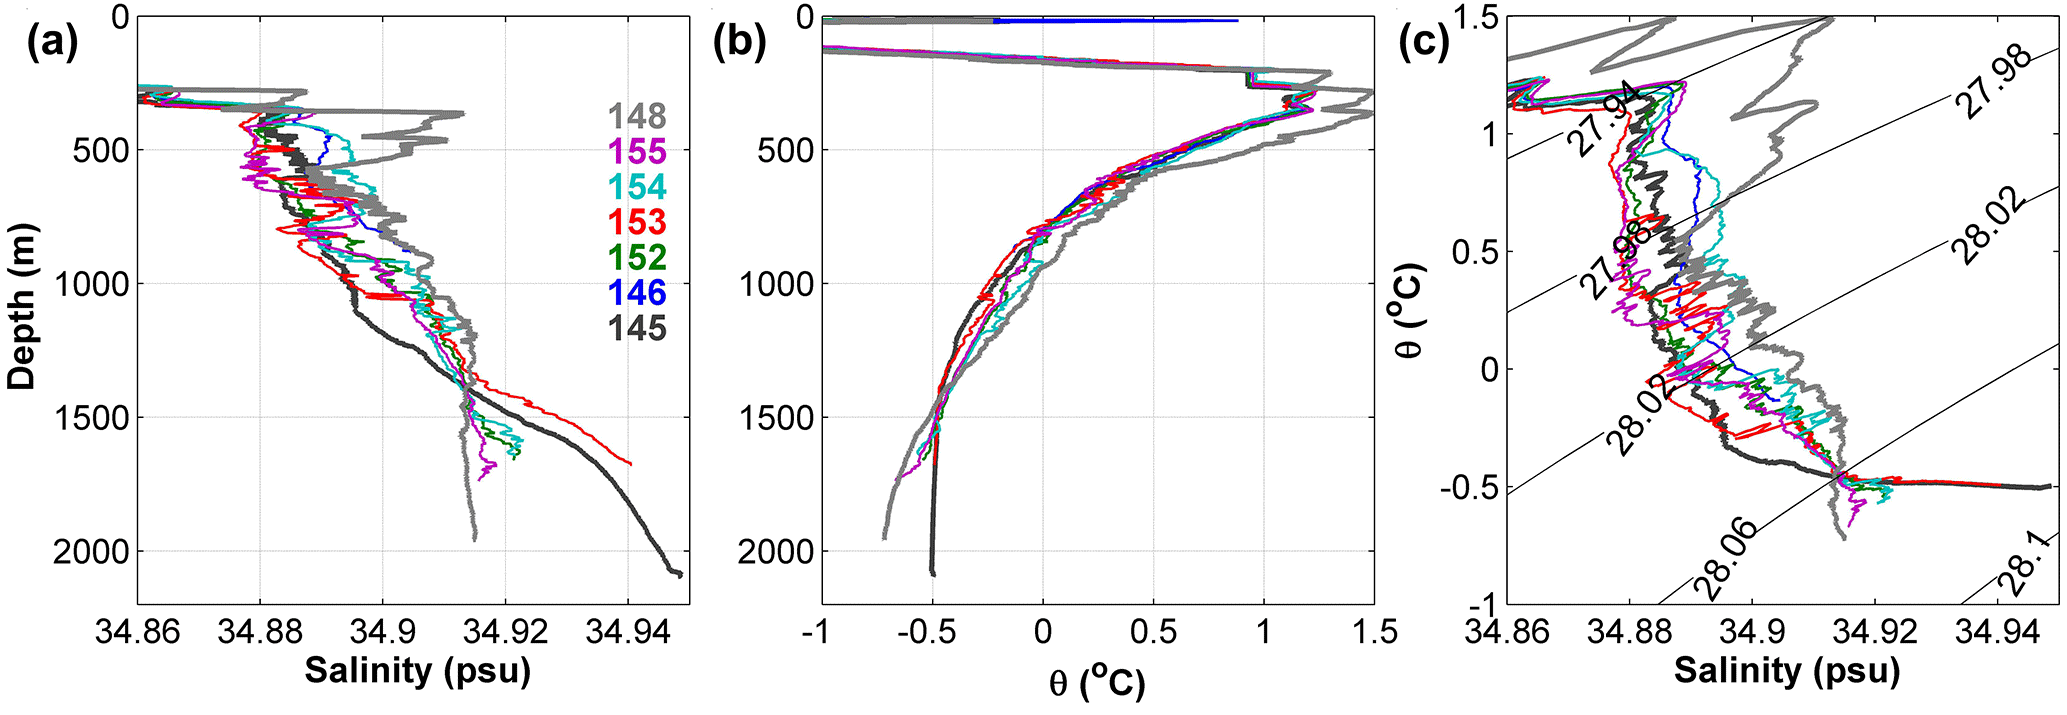
Figure 7Salinity and potential temperature (θ) profiles at the northern passage. The bold curves show reference stations in the Makarov Basin (stn. 145) and Amundsen Basin (stn. 148). For positions of the stations, please refer to Figs. 1 and 2.
3.2 Northern passage
The multibeam mapping at the northern passage reveals a trough-like structure in the LR extending from about 84∘24′–85∘3′ N in the north–south direction and 148–151∘ E in the east–west direction (Fig. 2b). The approximately 72 km long and 33 km wide trough forms an intra-basin in the LR morphology, which is not well expressed in IBCAO Version 3.0. The name “Oden Trough” for this feature was formally accepted by GEBCO's (General Bathymetric Chart of the Oceans) Sub-Committee on Undersea Feature Names in 2015 (Fig. 2d). The eastern side of Oden Trough is enclosed by rather steep walls rising 500–600 m above a generally 1600 m deep trough bottom. The deepest passage, i.e., the sill, between the Makarov and Amundsen basins is 1470 m and located at the eastern wall at about 84∘43′ N, 151∘15′ E (Fig. 2b, d). The western opening towards Amundsen Basin is located at the northern end of the trough and is deeper and substantially wider than the eastern sill. The deepest part of Oden Trough is 1704 m deep and located just northwest of the sill along the foot of the eastern wall, close to hydrographic station 152 (Fig. 2b). This deepening extends ∼ 10 km along the foot of the steep wall north of the sill and is well pronounced in the bottom morphology.
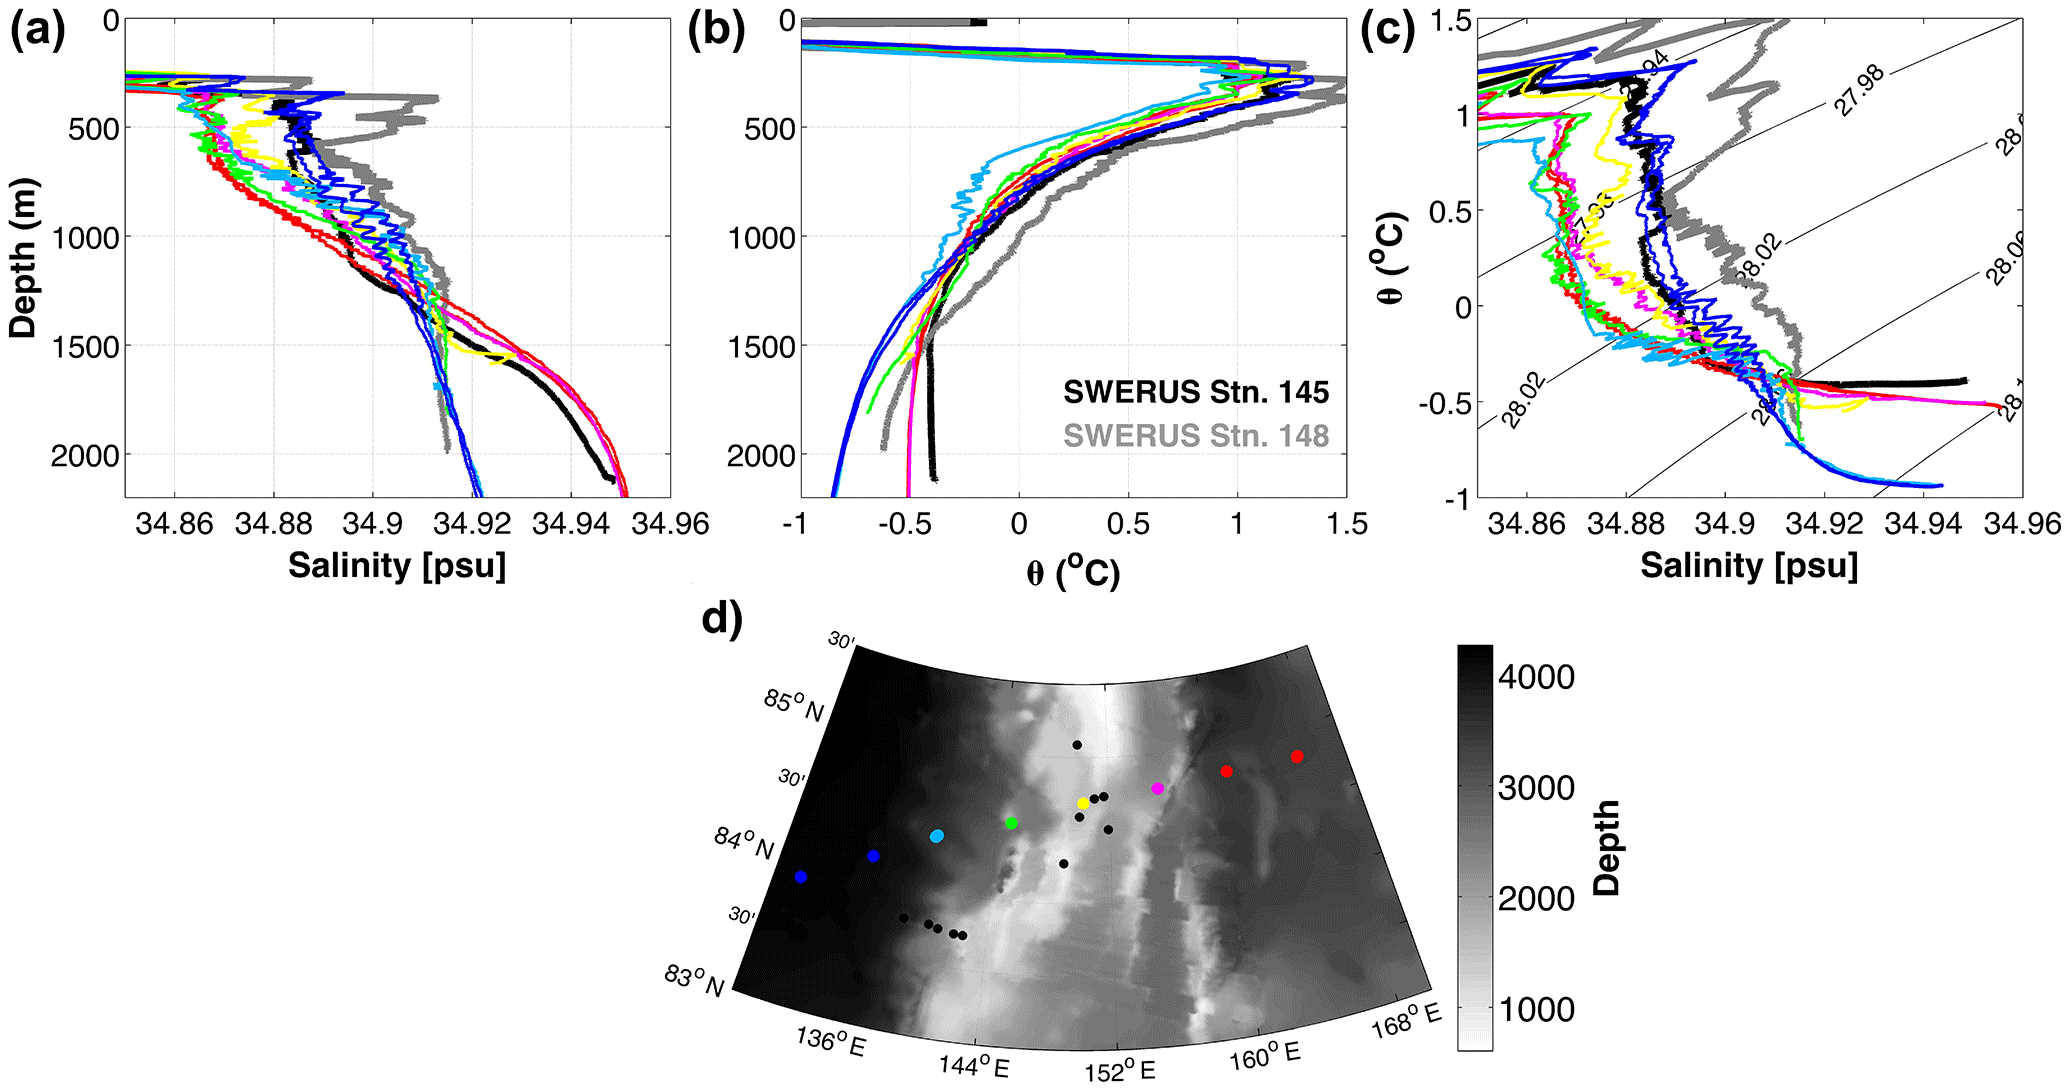
Figure 8Water mass characteristics across Lomonosov Ridge at the northern passage from a 2011 Polarstern cruise. The black and gray profiles mark the SWERUS-C3 reference stations for the Makarov (stn. 145) and Amundsen basins (stn. 148), respectively. The historical stations are color-coded according to longitude and water mass characteristics. Please refer to the map for their positions. Black dots show the SWERUS-C3 stations.
The θ–S profiles in this area (Fig. 7) show a quite irregular behavior with influences of water mass properties from each side of the ridge at different depth intervals. Station 153, located in the Makarov Basin near the sill, closely follows the reference profile in the Makarov Basin below 1400 m, but in the depth interval between 1100 and 1400 m it has more Amundsen Basin properties. At 1100 m, there is a sharp transition towards more Makarov Basin properties up to 800 m, while at 700 m depth again is a transition towards Amundsen Basin properties. In the AWL (300–600 m) the water mass has Makarov Basin properties as demonstrated by the salinity and temperature maximum at σθ = 27.94 kg m−3. The nearby station 152 on the Amundsen Basin side of the ridge shows more Amundsen Basin characteristics below the 1470 m sill depth as indicated by the salinity profile but is similar to the Makarov Basin in the θ–S plot. Further up in the column it follows the Amundsen Basin properties relatively closely, up to about 800 m, where it joins the Makarov Basin profile and has Makarov Basin properties all the way up to 300 m.
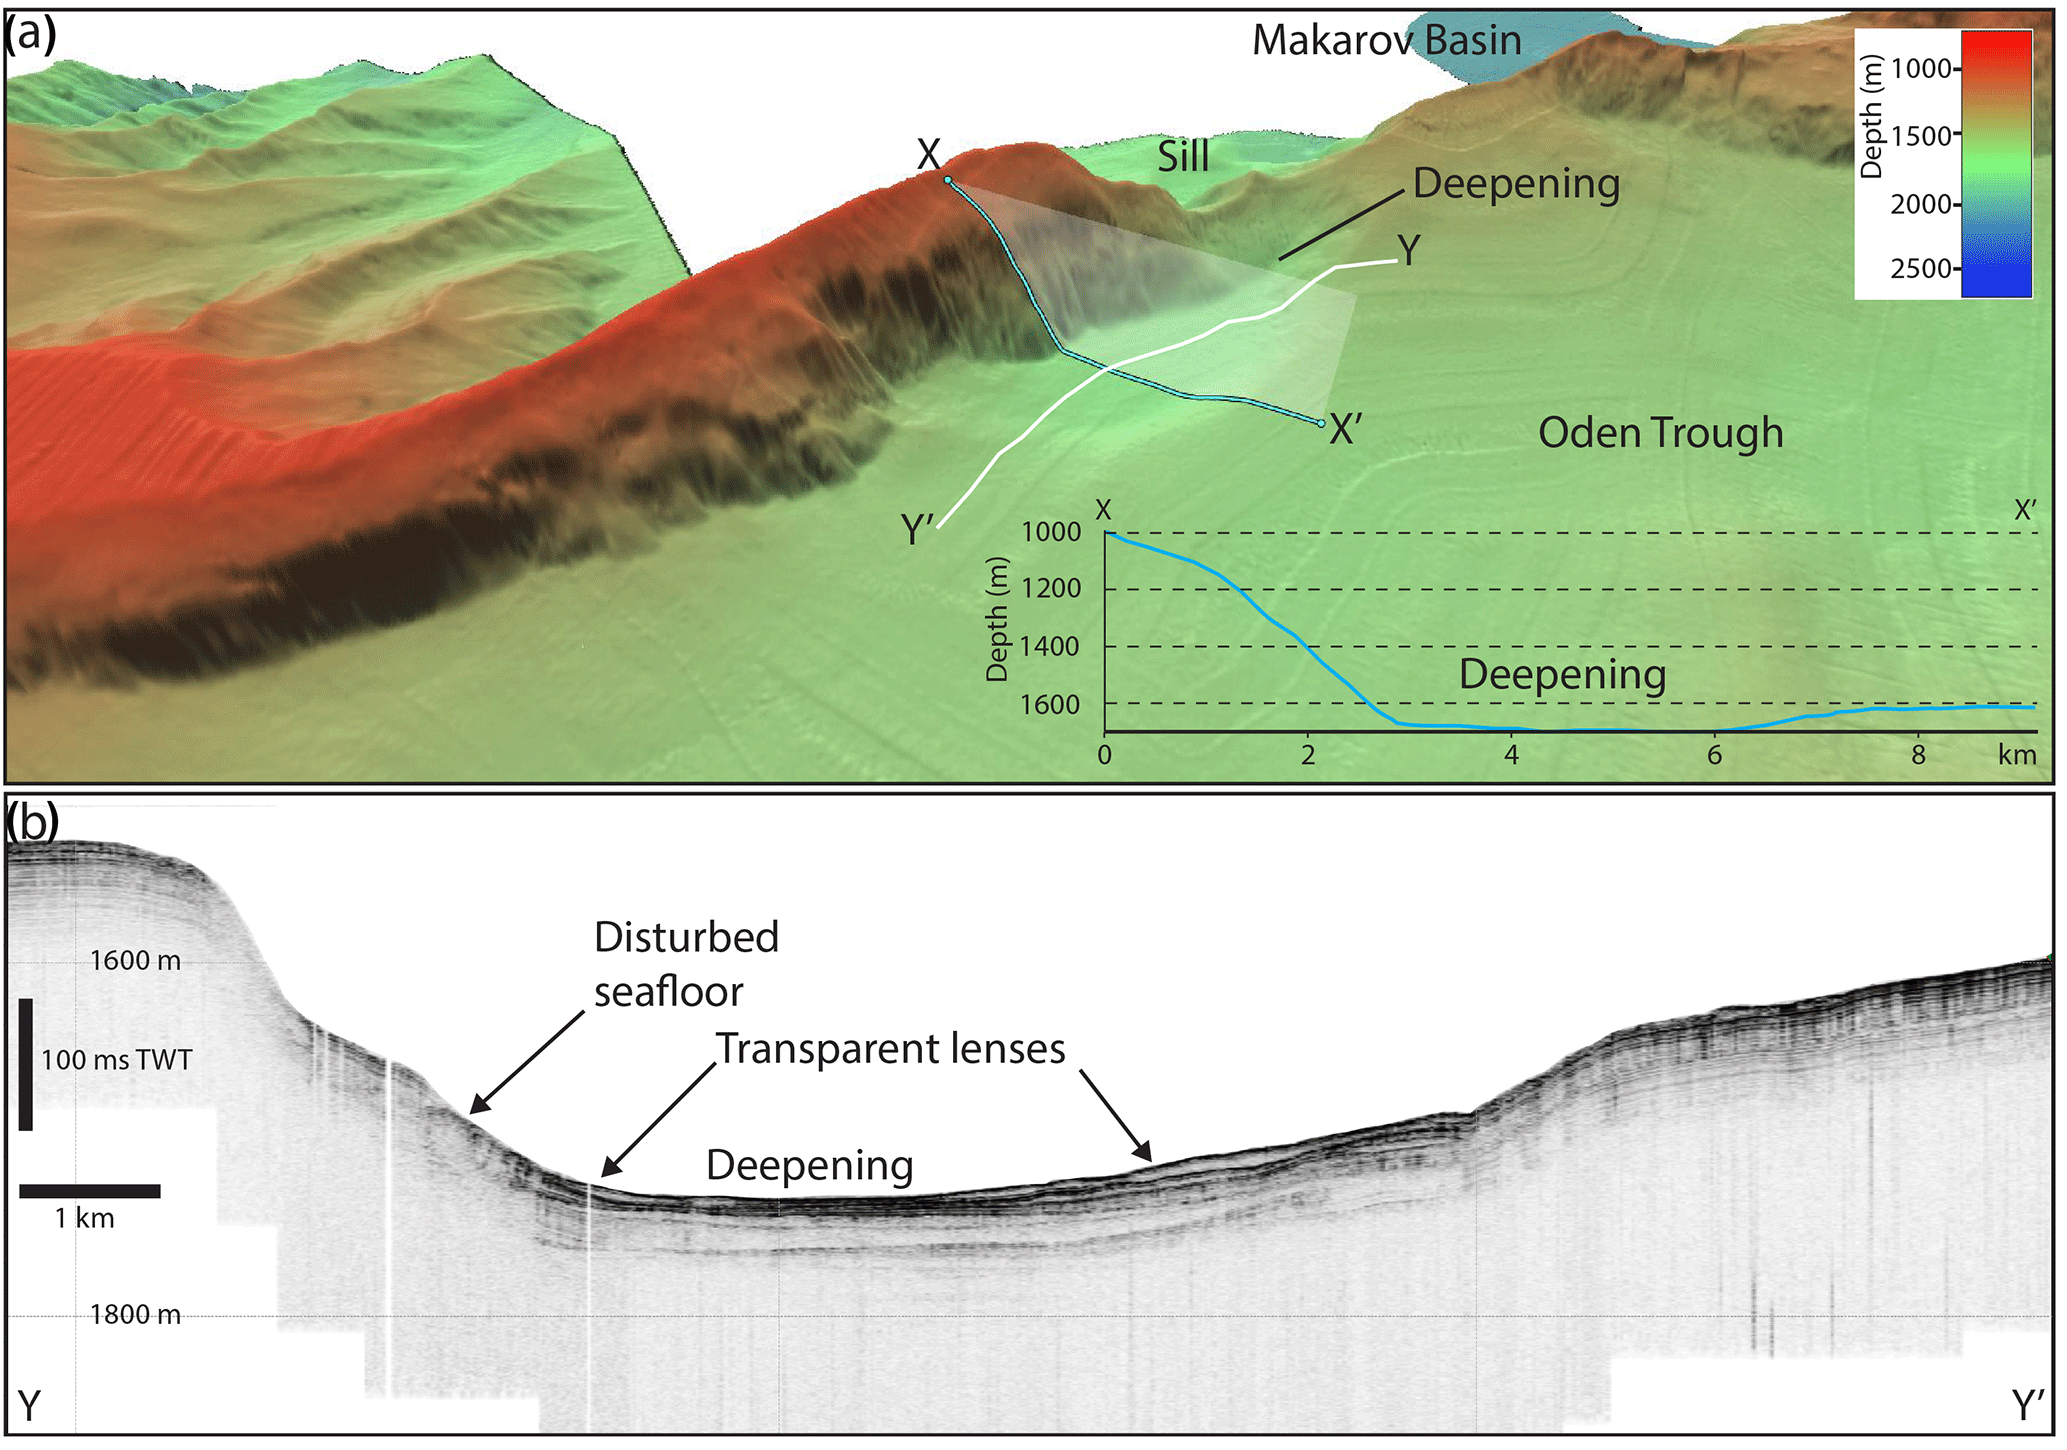
Figure 9(a) Detail of the northern passage in the vicinity of the sill showing a deepening which is possibly formed by long term seabed erosion by bottom currents. (b) Sub-bottom chirp sonar data along the section.
The station located at the western end of the passage close to the Amundsen Basin (stn. 155) has a structure more like the Amundsen Basin characteristics in the deepest part below 1400 m. In the interval 900–1400 m it has a mixture of properties. Above 900 m it undulates between clear Makarov and Amundsen Basin characteristics up to 700 m and Makarov properties dominates above this depth. Station 154 is located in a more central part of the trough where there is a local depression. This station also undulates between different water mass properties but is clearly more dominated by Amundsen Basin characteristics especially in the interval 400–800 m where it has significantly higher salinity.
It is difficult to interpret this complicated water mass structure based on a few semi-synoptic CTD stations but it is possible to deduce some general aspects. It appears that this is an area of active water exchange across the LR presenting properties from the basins on either side. The profiles suggest that this exchange is not a unidirectional organized flow but more likely interleaving motions resulting from double-diffusive mixing processes, which can create relatively distinct layers with variable flow directions, that are intermittent in nature (Rudels et al., 1999b). On one hand, an indication of the horizontal spatial structure of these flows is that Makarov Basin properties appear to dominate for stations 152 and 155 in the depth interval 300–900 m. Both of these stations are located near the northern high plateau suggesting a general flow from the Makarov Basin along the steep slope, but most of this flow appears to be occurring above 1000 m. On the other hand, we see Amundsen Basin characteristics around 700 m in the profile on the Makarov Basin side of the ridge indicating a flow from the Amundsen Basin. Additionally, the profiles from the Amundsen Basin side of the ridge show Makarov Basin properties below the sill depth indicating spillover of denser water from the Makarov Basin that is stored in the flat central area.
A 2011 Polarstern section (Schauer et al., 2012) crosses the LR at 84∘30′ N and provides a useful complement to the SWERUS-C3 stations (Fig. 8d). It shows an AWL core that is cooler and fresher than in 2014 (Fig. 8). The two westernmost (Fig. 8; dark blue) and easternmost (Fig. 8; red) stations show coherent water mass properties of the Amundsen and Makarov basins, respectively, and we will use them as reference stations for the two basins. Similarly to the SWERUS-C3 data, the four stations over the ridge show evidence of water mass exchange across the ridge. A station at 140∘ E (Fig. 8; light blue), west of the ridge, has the coolest and narrowest AWL of the section with salinities in the 300–700 m depth range similar to those on the Makarov side, but follows Amundsen characteristics below 800 m. A station east of the ridge at 156∘ E (Fig. 8; magenta) has mostly Makarov Basin characteristics but shows signs of an intrusion of water from the Amundsen side between 600 and 1200 m. Two stations at 145∘ E (Fig. 8; green) and 150∘ E (Fig. 8; yellow) show further indication of water mass exchange across the ridge. Notable is that the more western (Fig. 8; green) of those stations has the cold and fresh Makarov Basin characteristics down to 1300 m and follows the Amundsen Basin deep water below.
Both the SWERUS-C3 and historical data show that the northern passage is an area of active water exchange across the LR. The θ–S profiles indicate that this exchange occurs as midwater intrusions bringing water properties from each side of the ridge in well-defined but irregular layers. Similar irregular intrusions are found at the Kara Sea slope east of the St. Anna Trough where the Barents Sea branch of the Atlantic inflow enters and meets the Fram Strait branch as described above. A narrow front is formed in the confluence zone, which is highly unstable to horizontal perturbations due to double-diffusive fluxes starting to act when colder and fresher water comes on top of a layer with warmer and saltier water (and vice versa). The perturbations then grow to large amplitudes and form the irregular layers (Rudels et al., 1999b). A similar situation, with a narrow front between water masses of different θ–S properties and near-equal density, seems to be the case at the eastern wall of the Oden Trough where water with Amundsen Basin properties comes into close contact with water having Makarov Basin properties. Since the LR has a strong steering effect, with flows generally along the ridge, it reduces the water exchange between the major ocean basins and maintains a frontal structure between the water mass properties on each side, which is typically seen on hydrographic sections crossing the ridge (Rudels et al., 2013). Note that the flows on each side go in the opposite directions and therefore typically bring different water mass properties. At locations where the ridge morphology is narrow it can be expected that this front will be sharper. The narrow eastern wall of the northern passage (including the sill) appears to be such a feature which can guide the water masses streaming on either side of the ridge to come together, sharpening the horizontal property gradient and forming irregular intrusions. On one hand, it is expected that these intrusions have a very low cross-frontal speed since they are driven by the minute density gradients generated by the double-diffusive fluxes (McDougall, 1985).
On the other hand there are morphological expressions in the ridge seafloor that may result from more energetic flows in the vicinity of the sill. There is a nearly 100 m deepening, from the sill northward along the northern footwall of Oden Trough, possibly formed by long-term seabed erosion of bottom currents (Fig. 9a). The sub-bottom chirp sonar data collected along with the multibeam bathymetry show disturbed bottom sediments closest to the northern footwall, as well as transparent lenses with an acoustic appearance and stratigraphic location suggesting that they may be comprised of sediments redistributed by bottom currents (Fig. 9b).
3.3 Impact by Lomonosov Ridge
Finally we discuss some general aspects on how the LR effects the water circulation and property distribution in the Arctic Ocean. The deepest waters are directly isolated from each other by the ridge and there is a clear contrast in properties between the opposite sides with deep waters in the Amerasian Basin warmer and saltier water than those in the Eurasian Basin. As noted above, the ridge also affects the property distribution further up in the water column as seen in many hydrographic sections crossing the ridge (Rudels et al., 2013). The main reason for this property contrast is that the flow is largely barotropic with small vertical shear and tends to follow the bathymetry even far away from the bottom. It is therefore difficult for the flow to pass the ridge except at places where isobaths cross the ridge. The effect of the ridge is much less pronounced in the upper layers above 100 m, including the halocline and the surface mixed layer, where the circulation is more controlled by wind forcing and strong horizontal density gradients associated with the supply and spreading of freshwater from rivers and inflowing low-salinity water through the Bering Strait (Morison et al., 2012). The horizontal density gradients in the upper layers generate baroclinic motions which are decoupled from the topographical steering.
The southern passage provides a direct pathway above 1700 m for the warm Atlantic water streaming along the continental slope to enter the Amerasian Basin. It is mostly water from the colder Barents Sea branch that passes the ridge, while the warmer Fram Strait branch water turns and follows the ridge northwards (Rudels et al., 2013). A substantial part of the Fram Strait branch can also turn earlier and follow the Gakkel Ridge back towards the Fram Strait (Rudels et al., 2013). This means that most of the hydrographic sections crossing the ridge show a warmer Atlantic water core on the Amundsen Basin side than on the Makarov Basin side. How the dynamics actually determine the properties of the water passing the ridge, of which the temperature is a critical quantity, appears to be an open question. The temperature of the Atlantic water, including the seabed temperatures in the entire Amerasian Basin, should be highly dependent on this control. Current meter data from three moorings located at the Siberian shelf slope (one at each side of the LR) and one at the LR slope (Woodgate et al., 2001) show that the mean velocities are small and follow the depth contours. There are also numerous and strong cross-isobath flow events which are mostly related to mesoscale eddies but also likely due to wind forced up- and down-welling. This means that not only topographic steering but also other types of dynamics control the passage of water masses across the ridge. Also, the mixing between the Barents Sea and Fram Strait branches along the continental slope upstream from the LR will be critical.
The southern passage also appears to guide a westward flow of Makarov Basin water towards the Amundsen Basin as seen here and in earlier investigations. This flow is likely of an intermittent nature which is evident from the 1700 m mooring data in the Amundsen Basin side where the θ–S properties undulate between Makarov and Amundsen basin signatures (Woodgate et al., 2001). Our section shows that this flow is present over quite a large depth range from the seabed upwards to at least 500 m depth.
The northern passage seems to provide a different type of exchange in terms of interleaving motions above the 1470 m sill depth, with flow in opposite directions over different depth intervals. It is likely that this flow structure is less important for the exchange of properties across the ridge since velocities associated with double-diffusive interleaving should be small ∼ 5 mm s−1 (McDougall, 1985). Combining this with the relatively small horizontal scale of the passage of ∼ 50 km and a vertical scale ∼ 100 m results in a rather small volume flow of ∼ 0.05 Sv (sverdrup) compared with the 2 Sv estimated to pass eastward through the southern channel (Woodgate et al., 2001). However, the interleaving signals of Makarov Basin water are seen at quite large distances from the sill, which means that they actually carry properties across the entire LR and should therefore contribute to the overall water exchange across the ridge, but the question is to what extent. Information on the flow speeds, ideally from moored current meters, would be needed to decide the significance of the cross-ridge exchanges of volume, heat and salt in this northern passage.
There are also other deep channels which are pathways for flows crossing the ridge. Earlier investigations show that Canadian Basin Deep Water crosses the ridge through the 1870 m deep passage (the deepest passage) near the North Pole (Björk et al., 2007) and can be traced along the Amundsen Basin slope towards Greenland and further along the northern Greenland continental shelf slope (Björk et al., 2010). Signs of this water mass are also seen as a salinity maximum around 2000 m over a large part of the Amundsen Basin. Closer to Greenland, where the ridge meets the continental slope, there is a passage with sill depth of around 1200 m. The overall seafloor morphology in this area is similar to the passage near the Siberian continental slope at the other end of the ridge. This will cause a bifurcation of the westward rim current along the northern Canada continental slope, as also noted by Rudels et al. (2000). The shallow part crosses the ridge while the deeper part turns northward and flows towards Siberia along the LR flank on the Makarov Basin side. There are also indications that a part of the northward flowing branch is guided to cross the ridge hugging the slope around a 500 m depth shoal or at some deeper passages between the southern 1200 m passage near Greenland and the deepest 1870 m passage (for details see Björk et al., 2010).
Our study suggests that the exchange flows across the LR have a rather different character in the southern and the northern passages. In the southern one, on the one hand, the flow has a coherent vertical structure with unidirectional velocities over a large depth interval, but there is a horizontal division with flow directed towards the Makarov Basin in the southern part and the opposite in the northern part. In the northern passage, on the other hand, the flow is broken up into multiple shallow vertical layers with alternating velocity directions. Thus, our results highlight the question of what physical and bathymetrical features that control the nature of the exchange flow through the deep passages cutting across the LR.
Our survey of the bathymetry and hydrography in the southern passage shows that the detailed saddle bathymetry can have a strong influence on the flow of most dense Makarov Basin waters crossing the LR. Although our survey does not fully resolve the hydrography and bathymetry over the southern saddle, it does indicate that relatively minor topographical features may control it if the dense waters reaching the saddle cross over the ridge or return back to the Makarov Basin.
The possibility of more energetic flows in the vicinity of the sill at the northern passage, as inferred from morphological expressions in the ridge seafloor, is of interest from a dynamical perspective to study further in order to estimate expected flow speeds under different conditions.
CTD data can be accessed at the World Data Center PANGAEA. Chemical and Bathymetric data can be accessed at Bolin Centre Data Base, Stockholm University http://bolin.su.se/data/.
The authors declare that they have no conflict of interest.
The SWERUS-C3 expedition was financed by the Knut and Alice Wallenberg
Foundation, the Swedish Polar Research Secretariat and Stockholm University. Research grants
to Larry Mayer were provided by the US National Science Foundation grant no.
PLR-1417789. We also thank the crew of IB Oden for all their
professional help during the cruise. The 1995 and 1996 Polarstern data were
received via the National Oceanographic Data Center.
Edited by: Tommaso Tesi
Reviewed by: two anonymous referees
Aksenov, Y., Ivanov, V. V., Nurser, A. J. G., Bacon, S., Polyakov, I. V., Coward, A. C., Naveira-Garabato, A. C., and Beszczynska-Moeller, A.: The Arctic Circumpolar Boundary Current, J. Geophys. Res., 116, C09017, https://doi.org/10.1029/2010JC006637, 2011.
Anderson, L. G., Björk, G., Holby, O., Jones, E. P., Kattner, G., Koltermann, K. P., Liljebladh, B., Lindergren, R., Rudels, B., and Swift, J.: Water masses and circulation in the Eurasian basin: results from the Oden 91 expedition, J. Geophys. Res., 99, 3273–3283, https://doi.org/10.1029/93JC02977, 1994.
Biastoch, A., Treude, T., Rüpke, L. H., Riebesell, U., Roth, C., Burwicz, E. B., Park, W., Latif, M., Böning, C. W., Madec, G., and Wallmann, K.: Rising Arctic Ocean temperatures cause gas hydrate destabilization and ocean acidification, Geophys. Res. Lett., 38, L08602, https://doi.org/10.1029/2011GL047222, 2011.
Björk, G., Jakobsson, M., Rudels, B., Swift, J. H., Anderson, L., Darby, D. A., Backman, J., Coakley, B., Winsor, P., Polyak, L., and Edwards, M.: Bathymetry and deep-water exchange across the central Lomonosov Ridge at 88∘–89∘ N, Deep-Sea Res. I, 54, 1197–1208, 2007.
Björk, G., Anderson, L., Jakobsson, M., Antony, D., Eriksson, P. B., Eriksson, B., Hell, B., Hjalmarsson, S., Janzen, T., Jutterström, S., Linders, J., Löwemark, L., Marcussen, C., Olsson, K. A., Rudels, B., Sellén, E., and Sølvsten, M.: Flow of Canadian Basin Deep Water in the Western Eurasian Basin of the Arctic Ocean, Deep-Sea Res. I, 57, 577–586, https://doi.org/10.1016/j.dsr.2010.01.006, 2010.
Dmitrenko, I. A., Bauch, D., Kirillov, S. A., Koldunov, N., Minnett, P. J., Ivanov, V. V., Hölemann, J. A., and Timokhov, L. A.: Barents Sea upstream events impact the properties of Atlantic water inflow into the Arctic Ocean: Evidence from 2005 to 2006 downstream observations, Deep-Sea Res. I, 56, 513–527, https://doi.org/10.1016/j.dsr.2008.11.005, 2009.
Jakobsson, M., Nilsson, J., Anderson, L., Backman, J., Bjork, G., Cronin, T. M., Kirchner, N., Koshurnikov, A., Mayer, L., Noormets, R., O'Regan, M., Stranne, C., Ananiev, R., Barrientos Macho, N., Cherniykh, D., Coxall, H., Eriksson, B., Floden, T., Gemery, L., Gustafsson, O., Jerram, K., Johansson, C., Khortov, A., Mohammad, R., and Semiletov, I.: Evidence for an ice shelf covering the central Arctic Ocean during the penultimate glaciation, Nature Comm., 7, 1–10, https://doi.org/10.1038/ncomms10365, 2016.
Linders, J. and Björk, G.: The melt-freeze cycle of the Arctic Ocean ice cover and its dependence on ocean stratification, J. Geophys. Res., 118, 5963–5976, https://doi.org/10.1002/jgrc.20409, 2013.
McDougall, T. J.: Double-diffusive interleaving. Part II: Finite amplitude, steady state interleaving, J. Phys. Oceanogr., 15, 1542–1556, 1985.
Morison, J. , Kwok, R., Peralta-Ferriz, C., Alkire M., Rigor, I., Andersen, R., and Steele, M.: Changing Arctic Ocean freshwater pathways, Nature, 481, 66–70, https://doi.org/10.1038/nature10705, 2012.
Münchow, A., Falkner, K. K., and Melling, H.: Spatial continuity of measured seawater and tracer fluxes through Nares Strait, a dynamically wide channel bordering the Canadian Archipelago, J. Mar. Res., 65, 759–788, 2007.
Naryshkin, G.: Bottom relief of the Arctic Ocean, bathymetric contour map, scale 1:2 500 000, Russ. Acad. of Sci., St. Petersburg, Russia, 2001.
Nøst, O. A. and Isachsen, P. E.: The large-scale time-mean ocean circulation in the Nordic Seas and Arctic Ocean estimated from simplified dynamics, J. Mar. Res., 61, 175–210, https://doi.org/10.1357/002224003322005069, 2003.
Polyakov I. V., Timokhov, L. A., Alexeev, V. A., Bacon, S., Dmitrenko, I. A., Fortier, L., Frolov, I. E., Gascard, J.-C., Hansen, E., Ivanov, V. V., Laxon, S., Mauritzen, C., Perovich, D., Shimada, K., Simmons, H. L., Sokolov, V. T., Steele, M. and Toole, J.: Arctic ocean warming contributes to reduced polar ice cap, J. Phys. Oceanogr., 40, 2743–2756, https://doi.org/10.1175/2010JPO4339.1, 2010.
Polyakov, I. V., Pnyushkov, A. V., and Timokhov, L. A.: Warming of the intermediate Atlantic Water of the Arctic Ocean in the 2000s, J. Climate., 25, 8362–8370, https://doi.org/10.1175/JCLI-D-12-00266.1, 2012.
Rainville, L. and Winsor, P.: Mixing across the Arctic Ocean: Microstructure observations during the Beringia 2005 Expedition, Geophys. Res. Lett., 35, L08606, https://doi.org/10.1029/2008GL033532, 2008.
Rudels, B., Friedrich, H. J., and Quadfasel, D.: The Arctic Circumpolar Boundary Current, Deep-Sea Res. Pt. II, 46, 1023–1062, https://doi.org/10.1016/S0967-0645(99)00015-6, 1999a.
Rudels, B., Björk, G., Muench, R. D., and Schauer, U.: Double-Diffusive layering in the Eurasian basin of the Arctic Ocean, J. Marine Syst., 21, 3–27, 1999b.
Rudels, B., Muench, R. D., Gunn, J., Schauer, U., and Friedrich, H. J.: Evolution of the Arctic Ocean boundary current north of the Siberian shelves, J. Marine Syst. I, 25, 77–99, https://doi.org/10.1016/S0924-7963(00)00009-9, 2000.
Rudels, B., Schauer, U., Björk, G., Korhonen, M., Pisarev, S., Rabe, B., and Wisotzki, A.: Observations of water masses and circulation with focus on the Eurasian Basin of the Arctic Ocean from the 1990s to the late 2000s, Ocean Sci., 9, 147–169, https://doi.org/10.5194/os-9-147-2013, 2013.
Schauer, U., Rudels, B., Jones, E. P., Anderson, L. G., Muench, R. D., Björk, G., Swift, J. H., Ivanov, V., and Larsson, A.-M.: Confluence and redistribution of Atlantic water in the Nansen, Amundsen and Makarov basins, Ann. Geophys., 20, 257–273, https://doi.org/10.5194/angeo-20-257-2002, 2002.
Schauer, U., Rabe, B., and Wisotzki, A.: Physical oceanography during POLARSTERN cruise ARK-XXVI/3 (TransArc), Alfred Wegener Institute, Helmholtz Center for Polar and Marine Research, Bremerhaven, https://doi.org/10.1594/PANGAEA.774181, 2012.
Sirevaag, A. and Fer, I.: Early spring oceanic heat fluxes and mixing observed from drift stations north of Svalbard, J. Phys. Oceanogr., 39, 3049–3069, https://doi.org/10.1175/2009JPO4172.1, 2009.
Stranne, C., O'Regan, M., Dickens, G. R., Crill, P., Miller, C., Preto, P., and Jakobsson, M.: Dynamic simulations of potential methane release from East Siberian continental slope sediments, Geochemistry, Geophysics, Geosystems, 17, 872–886, https://doi.org/10.1002/2015GC006119, 2016.
Westbrook, G. K., Thatcher, K. E., Rohling, E. J., Piotrowski, A. M., Pälike, H., Osborne, A. H., Nisbet, E. G., Minshull, T. A., Lanoisellé, M., James, R. H., Hühnerbach, V., Green, D., Fisher, R. E., Crocker, A. J., Chabert, A., Bolton, C., Beszczynska-Möller, A., Berndt, C., and Aquilina, A.: Escape of methane gas from the seabed along the West Spitsbergen continental margin, Geophys. Res. Lett., 36, L15608, https://doi.org/10.1029/2009gl039191, 2009.
Woodgate, R. A., Aaagard, K., Muench, R. D., Gunn, J., Björk, G., Rudels, B., Roach, A. T., and Schauer, U.: The Arctic Ocean boundary current along the Eurasian slope and the adjacent Lomonosov Ridge: Water mass properties, transports and transformation from moored instruments, Deep-Sea Res. I, 48, 1757–1792, 2001.