the Creative Commons Attribution 4.0 License.
the Creative Commons Attribution 4.0 License.
 | 27 Jun 2018
Characteristics of chromophoric and fluorescent dissolved organic matter in the Nordic Seas
Piotr Kowalczuk
Sławomir Sagan
Mats A. Granskog
Alexey K. Pavlov
Agnieszka Zdun
Karolina Borzycka
Monika Zabłocka
Optical properties of chromophoric (CDOM) and fluorescent dissolved organic matter (FDOM) were characterized in the Nordic Seas including the West Spitsbergen Shelf during June–July 2013, 2014, and 2015. The CDOM absorption coefficient at 350 nm, aCDOM(350) showed significant interannual variation (T test, p < 0.00001). In 2013, the highest average aCDOM(350) values (aCDOM(350) = 0.30 ± 0.12 m−1) were observed due to the influence of cold and low-salinity water from the Sørkapp Current (SC) in the southern part of the West Spitsbergen Shelf. In 2014, aCDOM(350) values were significantly lower (T test, p < 0.00001) than in 2013 (average aCDOM(350) = 0.14 ± 0.06 m−1), which was associated with the dominance of warm and saline Atlantic Water (AW) in the region, while in 2015 intermediate CDOM absorption (average aCDOM(350) = 0.19 ± 0.05 m−1) was observed. In situ measurements of three FDOM components revealed that fluorescence intensity of protein-like FDOM dominated in the surface layer of the Nordic Seas. Concentrations of marine and terrestrial humic-like DOM were very low and distribution of those components was generally vertically homogenous in the upper ocean (0–100 m). Fluorescence of terrestrial and marine humic-like DOM decreased in surface waters (0–15 m) near the sea ice edge due to dilution of oceanic waters by sea ice meltwater. The vertical distribution of protein-like FDOM was characterized by a prominent subsurface maximum that matched the subsurface chlorophyll a maximum and was observed across the study area. The highest protein-like FDOM fluorescence was observed in the Norwegian Sea in the core of warm AW. There was a significant relationship between the protein-like fluorescence and chlorophyll a fluorescence (R2 = 0.65, p < 0.0001, n = 24 490), which suggests that phytoplankton was the primary source of protein-like DOM in the Nordic Seas and West Spitsbergen Shelf waters. Observed variability in selected spectral indices (spectral slope coefficient, S300–600, carbon-specific CDOM absorption coefficient at 254 and 350 nm, SUVA254, (350)) and the nonlinear relationship between CDOM absorption and the spectral slope coefficient also indicate a dominant marine (autochthonous) source of CDOM and FDOM in the study area. Further, our data suggest that aCDOM(350) cannot be used to predict dissolved organic carbon (DOC) concentrations in the study region; however the slope coefficient (S300–600) shows some promise in being used.
- Article
(5639 KB) -
Supplement
(867 KB) - BibTeX
- EndNote


The rapid reduction of summer sea ice in the Arctic Ocean in the past decades has various repercussions on the structure and functioning of the Arctic marine system, forcing changes in physics, biogeochemistry, and ecology of this complex oceanic system (Meier et al., 2014). One of the most significant consequences of observed rapid Arctic Ocean transition is an increase in the primary productivity of the Arctic Ocean (Arrigo et al., 2008), which could potentially contribute to increased production of autochthonous (marine) dissolved organic matter (DOM) in ice-free and under-ice waters. The sea ice is also a source of autochthonous DOM and its chromophoric (colored) subfraction, CDOM (e.g., Granskog et al., 2015a; Anderson and Amon, 2015; Retelletti-Brogi et al., 2018). However, dissolved organic carbon (DOC) produced by ice algae has a limited effect on overall organic carbon mass balance in the Arctic Ocean, as melting of 1 m of sea ice would negligibly change DOC concentration in the top 50 m of the water column, assuming an averaged DOC content in the ice of 100 µMol C (Anderson and Amon, 2015). Simultaneously, response of terrestrial ecosystems to temperature increase will accelerate permafrost thaw and increase the riverine discharge, resulting in more allochthonous (terrestrial) DOM being released into the Arctic Ocean (Amon, 2004; Stedmon et al., 2011; Anderson and Amon, 2015; Prowse et al., 2015, and references therein). Terrestrial DOM plays a considerable role in the carbon budget of the Arctic Ocean (Findlay et al., 2015; Stein and Macdonald, 2004), especially in coastal waters and the continental shelf with a large inflow of terrestrial DOM, which constitutes 80 % of total organic carbon delivered by Arctic rivers (Stedmon et al., 2011).
The optically active DOM fraction called CDOM represents light-absorbing molecules (Coble, 2007; Nelson and Siegel, 2013; Stedmon and Nelson, 2015). Once entered or produced in surface waters of the Arctic Ocean, CDOM has a significant influence on heating of the uppermost ocean layer and its stratification (Pegau, 2002; Hill, 2008; Granskog et al., 2007, 2015b). Particularly in the absence of sea ice, light absorbed by CDOM in the visible part of the spectrum limits the light available for photosynthetic organisms (Arrigo and Brown, 1996) but also shields marine ecosystems from potentially harmful ultraviolet radiation by strongly absorbing electromagnetic radiation in the UVB and UVA bands (Erickson III et al., 2015). CDOM is also an important substrate in photochemical reactions contributing to direct remineralization of organic carbon, production of bioavailable low-molecular-weight DOM but also formation of reactive oxygen species that could potentially be toxic to marine organisms (Mopper and Kieber, 2002; Kieber et al., 2003; Zepp, 2003). The mineralization by photochemical reactions or microbes of DOM, both terrestrial and marine, is a crucial but still insufficiently quantified mechanism in the Arctic carbon cycle (e.g., Osburn et al., 2009). Despite the importance of CDOM, studies on its distribution, properties, and transformation in the Arctic Ocean and its marginal seas are still limited, partly by their remoteness and seasonal accessibility.
A subfraction of CDOM fluoresces and is called fluorescent dissolved organic matter (FDOM). Recent advances in fluorescence spectroscopy (Coble, 1996) and data analysis techniques have provided a more comprehensive overview of FDOM characteristics. Based on excitation–emission spectra fluorescence spectroscopy, it is possible to distinguish amidst different origin groups of fluorophores, e.g., terrestrial, marine, and anthropogenic (Stedmon et al., 2003; Murphy et al., 2013, 2014). Use of in situ DOM fluorometers enables low cost and high sample rate observations of the distribution of FDOM and related biogeochemical proxies with greater temporal and spatial resolution (Belzile et al., 2006; Kowalczuk et al., 2010).
The North Atlantic sector of the Arctic Ocean is a region with a complex interaction between inflowing warm and highly productive AW entering the Arctic and cold and fresh Polar Surface Water (PSW) exiting the Arctic Ocean. Recent studies have reported intensification of AW inflow into the Arctic Ocean (Walczowski, 2014; Polyakov et al., 2017; Walczowski et al., 2017), further highlighting the importance of the European sector of the Arctic Ocean to better understand the complex interactions between inflowing AW and PSW. Optically these waters are contrasting, especially with respect to CDOM (Granskog et al., 2012; Pavlov et al., 2015; Stedmon et al., 2015) and FDOM (Jørgensen et al., 2014; Gonçalves-Araujo et al., 2016). In the absence of sea ice, favorable vertical mixing conditions and sufficient levels of solar radiation make it a very productive and important region from an ecosystem and socioeconomic standpoint, thus ensuring motivation for ongoing studies of the complex marine system in the area (Skogen et al., 2007; Olsen et al., 2009; Dalpadado et al., 2014). In the context of ongoing and further anticipated intensification of Atlantic Ocean inflow to the Arctic Ocean, a description of processes and factors controlling CDOM and FDOM properties and distribution could be used to better predict future changes associated with CDOM in the areas upstream of the AW inflow region, to estimate glacial meltwater (Stedmon et al., 2015), and to trace water masses (Gonçalves-Araujo et al., 2016).
A number of occasional synoptic surveys of CDOM and optical properties have been conducted in the different regions of the European Arctic Ocean and concentrated on the western part of the Fram Strait influenced by polar water outflow with the East Greenland Current (EGC) (Granskog et al., 2012; Pavlov et al., 2015; Gonçalves-Araujo et al., 2016). The CDOM distribution in the area influenced by AW was reported by Stedmon and Markager (2001) in the central part of the Greenland Sea, and by Granskog et al. (2012) and Pavlov et al. (2015), who presented CDOM and particulate absorption distribution along a transect across the Fram Strait at 79∘ N. Hancke et al. (2014) studied the seasonal distribution of the CDOM absorption coefficient (aCDOM(λ)) in an area across the Polar Front in the central part of the Barents Sea. Seasonal studies on CDOM contribution to overall variability in inherent optical properties (IOPs) reported on sea ice (Kowalczuk et al., 2017) and in the water column during a spring under-ice phytoplankton bloom north of Svalbard (Pavlov et al., 2017). In this study we aimed to present variability in CDOM and FDOM optical properties in a large area spanning parts of the Barents, Norwegian, and Greenland seas (particularly focusing on the West Spitsbergen Shelf) over a period of 3 consecutive years (2013–2015) and understand the role of (i) large-scale ocean circulation patterns and water mass distribution and (ii) phytoplankton productivity as controlling factors on CDOM and FDOM distribution.
2.1 Study area
Observations were carried out in the framework of the long-term observational program AREX, conducted since 1987 by the Institute of Oceanology, Polish Academy of Sciences, Sopot, Poland, and covered the area of water mass exchange between the North Atlantic Ocean and the Arctic Ocean (Fig. 1). The Norwegian, Barents, and Greenland seas, called the Nordic Seas, represent a crucial component of the Northern Hemisphere climate system due to two contrasting water masses and their contribution to the heat and salt exchanges between the North Atlantic and the Arctic Ocean (Walczowski, 2014; Schlichtholz and Houssais, 1999a, b). The warm and salty AW are carried northward by the North Atlantic Current (NAC), which further splits into two major branches. The Norwegian Current (NC) flows into the Barents Sea as the Barents Sea branch, while the West Spitsbergen Current (WSC) heads north along the eastern flank of the Fram Strait. The EGC flows south along the western side of the Fram Strait and carries cold and low-salinity PSW and sea ice (Fig. 1) (e.g., Schlichtholz and Houssais, 2002). The East Spitsbergen Current (ESC) could also affect the region with transformed polar water originating from the northeastern Barents Sea (Sternal et al., 2014). The main ESC branch flows southward along the coast of Spitsbergen and its extension is the SC, which influences the West Spitsbergen Shelf. The remaining part of polar water from the Barents Sea flows southwestward along the eastern slope of the Spitsbergenbanken towards Bear Island as the Bjørnøya Current (Loeng, 1991) in the Norwegian Sea and the Barents Sea border. Presence and extensiveness of polar water from the Barents Sea depends on favorable wind conditions affecting the magnitude and the exchange with the AW inflow (Nilsen et al., 2015; Walczowski, 2014).
Optical measurements and water sampling were conducted during three summer Arctic expeditions (AREX) onboard R/V Oceania in 2013, 2014, and 2015 (AREX2013, AREX2014, and AREX2015, respectively) (Table 1). In situ FDOM fluorescence measurements were conducted in 2014 and 2015. AREX expeditions covered the Norwegian Sea with a main section along the border between the Norwegian Sea and the Barents Sea (sampled in late June to early July 2014 and 2015). The area of the western and northern Spitsbergen shelf was investigated in July of 2013–2015 (Fig. 1), along sections spanning from shelf towards the sea ice edge. The westernmost and northernmost sampling stations north of 76∘ N, shown in Fig. 1, correspond to the sea ice edge position in July in the given year.
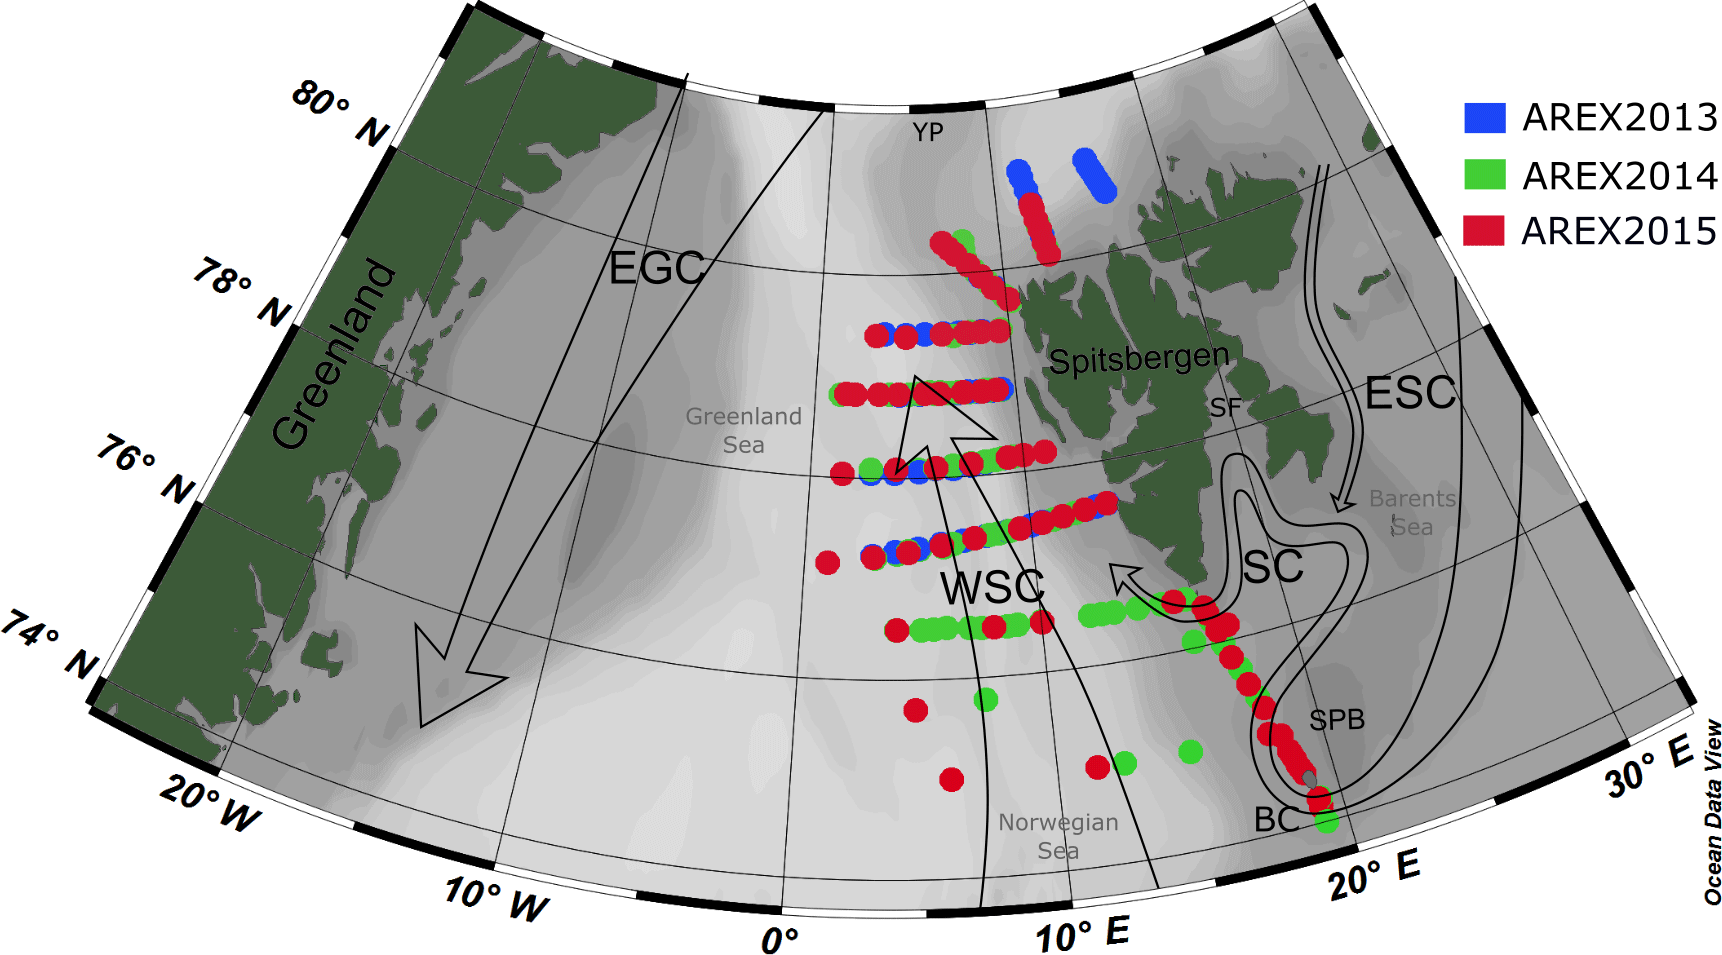
Figure 1Map of the sampling stations during AREX2013 (blue circles), AREX2014 (green circles), and AREX2015 (red circles) with general surface circulation patterns in the Nordic Seas. Atlantic waters: WSC, West Spitsbergen Current. Polar waters: ESC, East Spitsbergen Current; SC, Sørkapp Current; EGC, East Greenland Current; BC, Bjørnøya Current; YP, Yermak Plateau; SF, Storfjorden; SPB, Spitsbergenbanken.
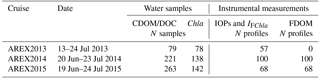
Table 1Dates of AREX expeditions, and number of samples or number of in situ vertical profiles of CDOM, DOC, chlorophyll a (Chla) inherent optical properties (IOPs), chlorophyll a fluorescence (IFChla), and FDOM fluorescence.
2.2 Sample collection and processing
Water samples for determination of CDOM absorption, chlorophyll a, and DOC were collected with a Sea-Bird SBE32 Carousel Water Sampler equipped with Niskin bottles, an SBE 911plus conductivity–temperature–depth (CTD) probe (SBE 9plus CTD unit and SBE 11plus Deck Unit), and WET Labs ECO chlorophyll fluorometer. Samples were collected at three depths: near the surface, ca. 2 m depth, at the chlorophyll a maximum, which was usually located between 15 and 25 m depth, and below the chlorophyll a maximum, between 50 and 70 m. The exact position of chlorophyll a maximum depth was estimated from the vertical profile of chlorophyll a fluorescence during the CTD downcast. During AREX2013 water samples for CDOM absorption measurements were immediately filtered in two steps: first through acid-washed GF/F filters, and second through acid-washed Sartorius 0.2 µm pore size cellulose membrane filters to remove finer particles. In 2014 and 2015 CDOM samples were filtered directly from rosette Niskin bottles through a Millipore Opticap XL4 Durapore filter cartridge with nominal pore size 0.2 µm into acid-washed 200 mL amber glass bottles. The cartridge filter was kept in 10 % HCl solution and was rinsed with ultrapure Milli-Q and sample water before collecting CDOM samples. In 2013 and 2015 collected unpreserved water samples for determination of CDOM absorption were stored onboard R/V Oceania in the dark, at a temperature of 4 ∘C, and were transferred after the cruise to a land-based laboratory for spectroscopic measurements. In 2014, all spectroscopic measurements for the determination of CDOM absorption were carried out in the laboratory onboard R/V Oceania, immediately after collection. Samples for determination of DOC concentration were collected the same way as CDOM samples. Water that passed through 0.2 µm filters was collected into pre-cleaned 40 mL glass vials (certified pre-cleaned sample vials, Sigma-Aldrich) and acidified with a drop of concentrated 38 % HCl. Acidified samples were stored onboard the ship in the dark, at a temperature of 4 ∘C, and were transferred after the cruise to a land-based laboratory for measurements.
Water samples for the determination of chlorophyll a concentration were filtered immediately after collection under low vacuum on Whatman (GE Healthcare, Little Chalfont, UK) 25 mm GF/F filters. Filter pads with particulate material retained on them were immediately deep frozen in a freezer and thereafter stored at −80 ∘C prior to analyses.
2.3 CDOM absorption
Before spectroscopic scans were conducted, the temperature of the CDOM absorption samples was increased to room temperature. CDOM absorption for AREX2013 and AREX2015 was measured using a double-beam PerkinElmer LAMBDA 650 spectrophotometer in the spectral range 240–700 nm, in the laboratory at the Institute of Oceanology, Polish Academy of Sciences in Sopot, Poland. Measurements of the CDOM absorption samples collected during AREX2014 were carried out onboard the research vessel, using a double-beam PerkinElmer LAMBDA 35 spectrophotometer in the same spectral range as in 2013 and 2015. The 10 cm quartz cuvette was chosen for all measurements and the reference was fresh ultrapure water. Absorbance A(λ) spectra were transformed to the CDOM absorption coefficients, aCDOM(λ) (m−1), according to
where 2.303 is the natural logarithm of 10, A(λ) is the corrected spectrophotometer absorbance reading at a specific wavelength (λ), and L is the path length of optical cell in meters (here 0.1 m).
The slope coefficient of the CDOM absorption spectrum, S, between 300 and 600 nm was derived using Eq. (2) and was implemented in MATLAB R2011b by adopting a nonlinear least-squares fit with a trust-region algorithm (Stedmon et al., 2000; Kowalczuk et al., 2006):
where λ0 is a reference wavelength (here 350 nm), and K is a background constant representing any possible baseline shifts not due to CDOM absorption. Simultaneous calculation of three parameters: aCDOM(350), S, and K was performed according to Eq. (2) in the spectral range between 300 and 600 nm by nonlinear regression. CDOM absorption coefficient values are also included at two other wavelengths, aCDOM(375) and aCDOM(443), to enable direct comparison of our results with previously published studies. In 2014 the range of the spectral slope coefficient had to be reduced to 300–500 nm due to spectra disturbances over 500 nm in the data set from the western and northern Spitsbergen shelf. To assess the effect of the narrower spectral range on spectral slope coefficient calculations, we calculated slopes for both spectral ranges in 2013 and 2015. On average, the spectral slope coefficient in the spectral range 300–500 nm was higher by 1.76 µm−1 relative to S300–600. Calculated average bias was deduced from S300–500 calculated in 2014 to comply with the 2013 and 2015 data sets. A linear regression model was used on log-transformed CDOM absorption spectra for spectral slope coefficient calculations at the spectral range 275–295 nm, S275–295.
2.4 Chlorophyll a concentration
Filters pads containing suspended particles (including pigments) were used for determination of the chlorophyll a concentration for all AREX cruises. Pigments were extracted at room temperature in 96 % ethanol for 24 h. Spectrophotometric determination of chlorophyll a concentration, Chla [mg m−3], was performed with two spectrophotometers: UV4–100 (Unicam, Ltd) and a PerkinElmer LAMBDA 650 in 2013 and 2014–2015, respectively. The optical density (absorbance) of pigment extract in ethanol was measured at 665 nm. Background signal was corrected in the near-infrared region of the electromagnetic spectrum (750 nm): ΔOD = OD(665 nm) − OD(750 nm). Subsequently, conversion of absorbance to chlorophyll a was carried out according to the following equation (Strickland and Parsons, 1972; Stramska et al., 2003):
where 83 (dm3 (g cm)−1) is the chlorophyll a specific absorption coefficient in 96 % ethanol, Vw (dm3) is the volume of filtered water, VEtOH (dm3) is ethanol extract volume, and l is the path length of the cuvette (here 2 cm).
2.5 DOC concentration
DOC measurements were performed with a “HyPer+TOC” analyzer (Thermo Electron Corp., the Netherlands) using UV persulfate oxidation and nondispersive infrared detection (Sharp, 2002). Potassium hydrogen phthalate was used as a standard addition measurement method for each sample in triplicate. Consensus reference material (CRM) supplied by Hansell Laboratory from the University of Miami was analyzed as a quality control of DOC concentrations. The methodology provided sufficient accuracy (average recovery 95 %; n = 5; CRM = 44–46 µM C; our results = 42–43 µM C) and precision represented by a relative standard deviation (RSD) of 2 %.
The carbon-specific CDOM absorption coefficient at 350 nm, (350) (m2 g−1), was determined as the ratio of the CDOM absorption coefficient at a given wavelength aCDOM(350) to the DOC concentration (Eq. 4):
where DOC is expressed in milligrams per liter.
The carbon-specific UV absorption coefficient (SUVA) is defined as the UV absorbance of the water sample at a specific wavelength normalized for DOC concentration [mg L−1] (Weishaar et al., 2003). SUVA (m2 gC−1) at 254 nm (SUVA254, Eq. 5) is an indicator of aromaticity of aquatic humic substances and was calculated as
2.6 Instrumental in situ measurements of inherent optical properties, FDOM, and chlorophyll a fluorescence
Vertical profiles of IOPs, FDOM, and chlorophyll a fluorescence together with conductivity, temperature, and pressure were measured at all stations from the surface down to 200 m depth using an integrated instrument package consisting of an ac-9 plus attenuation and absorption meter (WET Labs Inc., USA), a WETStar CDOM fluorometer (WET Labs Inc., USA), a microFlu-chl chlorophyll a fluorometer (Trios GmbH, Germany), and a Sea-Bird SBE 49 FastCAT CTD probe (Sea-Bird Electronics, USA).
Spectral light absorption, a(λ), and beam attenuation, c(λ), coefficients were measured at nine wavelengths (412, 440, 488, 510, 532, 555, 650, 676, and 715 nm). The ac–9 plus calibrations were performed regularly. After cleaning with ultrapure water, stability instrument readings were inspected with in-air measurements. The required correction of absorption signal for scattering was performed with the so-called proportional method by which zero absorption is estimated at 715 nm (Zaneveld et al., 1994). Subtraction of absorption coefficients from attenuation coefficients determined volume scattering coefficient, b(λ). The excitation channel and maximum emission of light detector of the microFlu-chl chlorophyll a fluorometer were set at 470 and at 686 nm, respectively. Recorded chlorophyll a fluorescence intensity signals, IFChla, were reported as analog voltage output in the range 0–5 V DC. The instrument setup is described in detail in Granskog et al. (2015b).
FDOM was measured using a three-channel WET Labs WETStar fluorometer equipped with two laser LEDs that excited the water sample inside the flow-through quartz cell at 280 and 310 nm, and two detectors to measure emission intensity at 350 and 450 nm. Such construction allowed for combinations of three channels with distinct excitation–emission features in specific peak areas as given in Coble (1996): Channel 1 (CH1), ex. = 310 nm and em. = 450 nm, represents marine ultraviolet humic-like peak C and marine humic-like peak M; Channel 2 (CH2), ex. = 280 nm and em. = 450 nm, represents UVC terrestrial humic-like peak A; and Channel 3 (CH3), ex. = 280 nm and em. = 350 nm, represents the protein-like tryptophane peak T (Fig. S1 in the Supplement). ICHn is the fluorescence intensity at a particular channel, where n denotes the channel number from 1 to 3. Recorded ICHn could be transformed from raw instrument counts into either the quinine sulfate equivalent (QSE) units, or particular compound concentrations with factory calibration curves. Application of the factory calibration curves, especially the blank ultrapure water readings offset, resulted in negative values for ICH1 and ICH2. Therefore, we reported fluorescence intensities acquired from the WETStar fluorometer in raw counts (RC) corrected for a noticeable but small drift. This offset was determined as the difference in any ICHn, between initial measurements in July 2014 in the depth range 100–150 m, at salinity > 34.9, and temperature T > 0 ∘C and measurements repeated in the same salinity and temperature range during the field campaign in 2015. The water salinity and temperature characteristics at the chosen depth range were typical for the core of AW inflow, which is characterized with stable values of spectral absorption (measured with an ac–9 plus attenuation and absorption meter), negligible chlorophyll a, and very low background CDOM absorption levels (Sławomir Sagan, personal communication, 2017). Therefore, we assume that any differences in raw WET Labs WETStar three-channel fluorometer readings between measurements in 2014 and 2015 resulted from instrument drift, and the offset between the years has been subtracted from florescence intensity values at each channel measured in 2015.
2.7 Classification of water masses
Water masses were classified according to Rudels et al. (2005) based on potential temperature (Θ), potential density (σθ), and salinity (S). The original classification definitions are derived for Fram Strait (Rudels et al., 1999) and categorization used in Rudels et al. (2002, 2005) considers mainly the EGC, the area of the Yermak Plateau and Storfjorden located on the east coast of Spitsbergen. To adjust the classification to the broader area of the Nordic Seas including the Atlantic part (Norwegian and Barents seas), some modifications have been introduced (see Table S1 in the Supplement).
The epipelagic layer of the Nordic Seas is dominated by AW and PSW and waters formed in the mixing process and local modifications (precipitation, sea ice melt, riverine runoff, and surface heating or cooling) of these two water masses. AW masses were usually characterized by potential temperature and density thresholds defined by Rudels et al. (2005) (Table S1). To better distinguish AW from PSW, we added a third criterion: any water mass classified as PSW (Rudels et al., 2005) with salinity higher than S > 34.9 has been considered to be AW. The salinity criterion equal to 34.9 is widely used in the literature (Swift and Aagaard, 1981; Schlichtholz and Houssais, 2002; Walczowski, 2014) and eliminates the classification ambiguity of Rudels et al. (2005) caused by modification of AW by local sources of fresh water. Part of AW (except PSW warm, PSWw) included waters with a density below σθ=27.7 kg m−3 (marked in Fig. 3 with dashed isopycnal line) used by Rudels et al. (2005) as a threshold value between AW and PSW. Lower density of waters of Atlantic domain with high salinity (> 34.9) is predominantly caused by high temperatures and cannot be referred to as PSW, the lower density of which is attributed to lower salinity. PSW is defined as Θ≤0 ∘C and σθ≤27.7 kg m−3. The temperature of PSW is usually negative; however, positive temperatures (3–5 ∘C) can be observed during summer (Swift and Aagaard, 1981). Warmer PSWw has been considered here with the same σθ≤27.7 kg m−3 criterion and Θ > 0 ∘C (Rudels et al., 2005), due to summer season measurements and higher temperatures of low-salinity surface waters in the eastern Fram Strait. Furthermore, PSWw was also limited to the uppermost 50 m of the water column with S≤34.9. The water mass with similar temperature–salinity (TS) characteristics to PSWw but slightly different ranges was referred to in the literature for Arctic Surface Water, ASW (e.g., Pavlov et al., 2015; Gonçalves-Araujo et al., 2016), but due to the dominance in the area of water originating from the Atlantic Ocean the name PSWw from Rudels et al. (2005) classification is used. We could find Arctic Atlantic Water (AAW) in our data set as a result of the mixing process of AW and PSW, in the range of 0 < Θ≤2 ∘C and 27.7 < σθ≤27.97 (Rudels et al., 2005). Arctic Intermediate Water (AIW) was defined as Θ≤0.3 ∘C and 27.97 < σθ, σ0.5≤30.44 (Rudels et al., 2005) and included measurements taken at the greatest depth in this study.
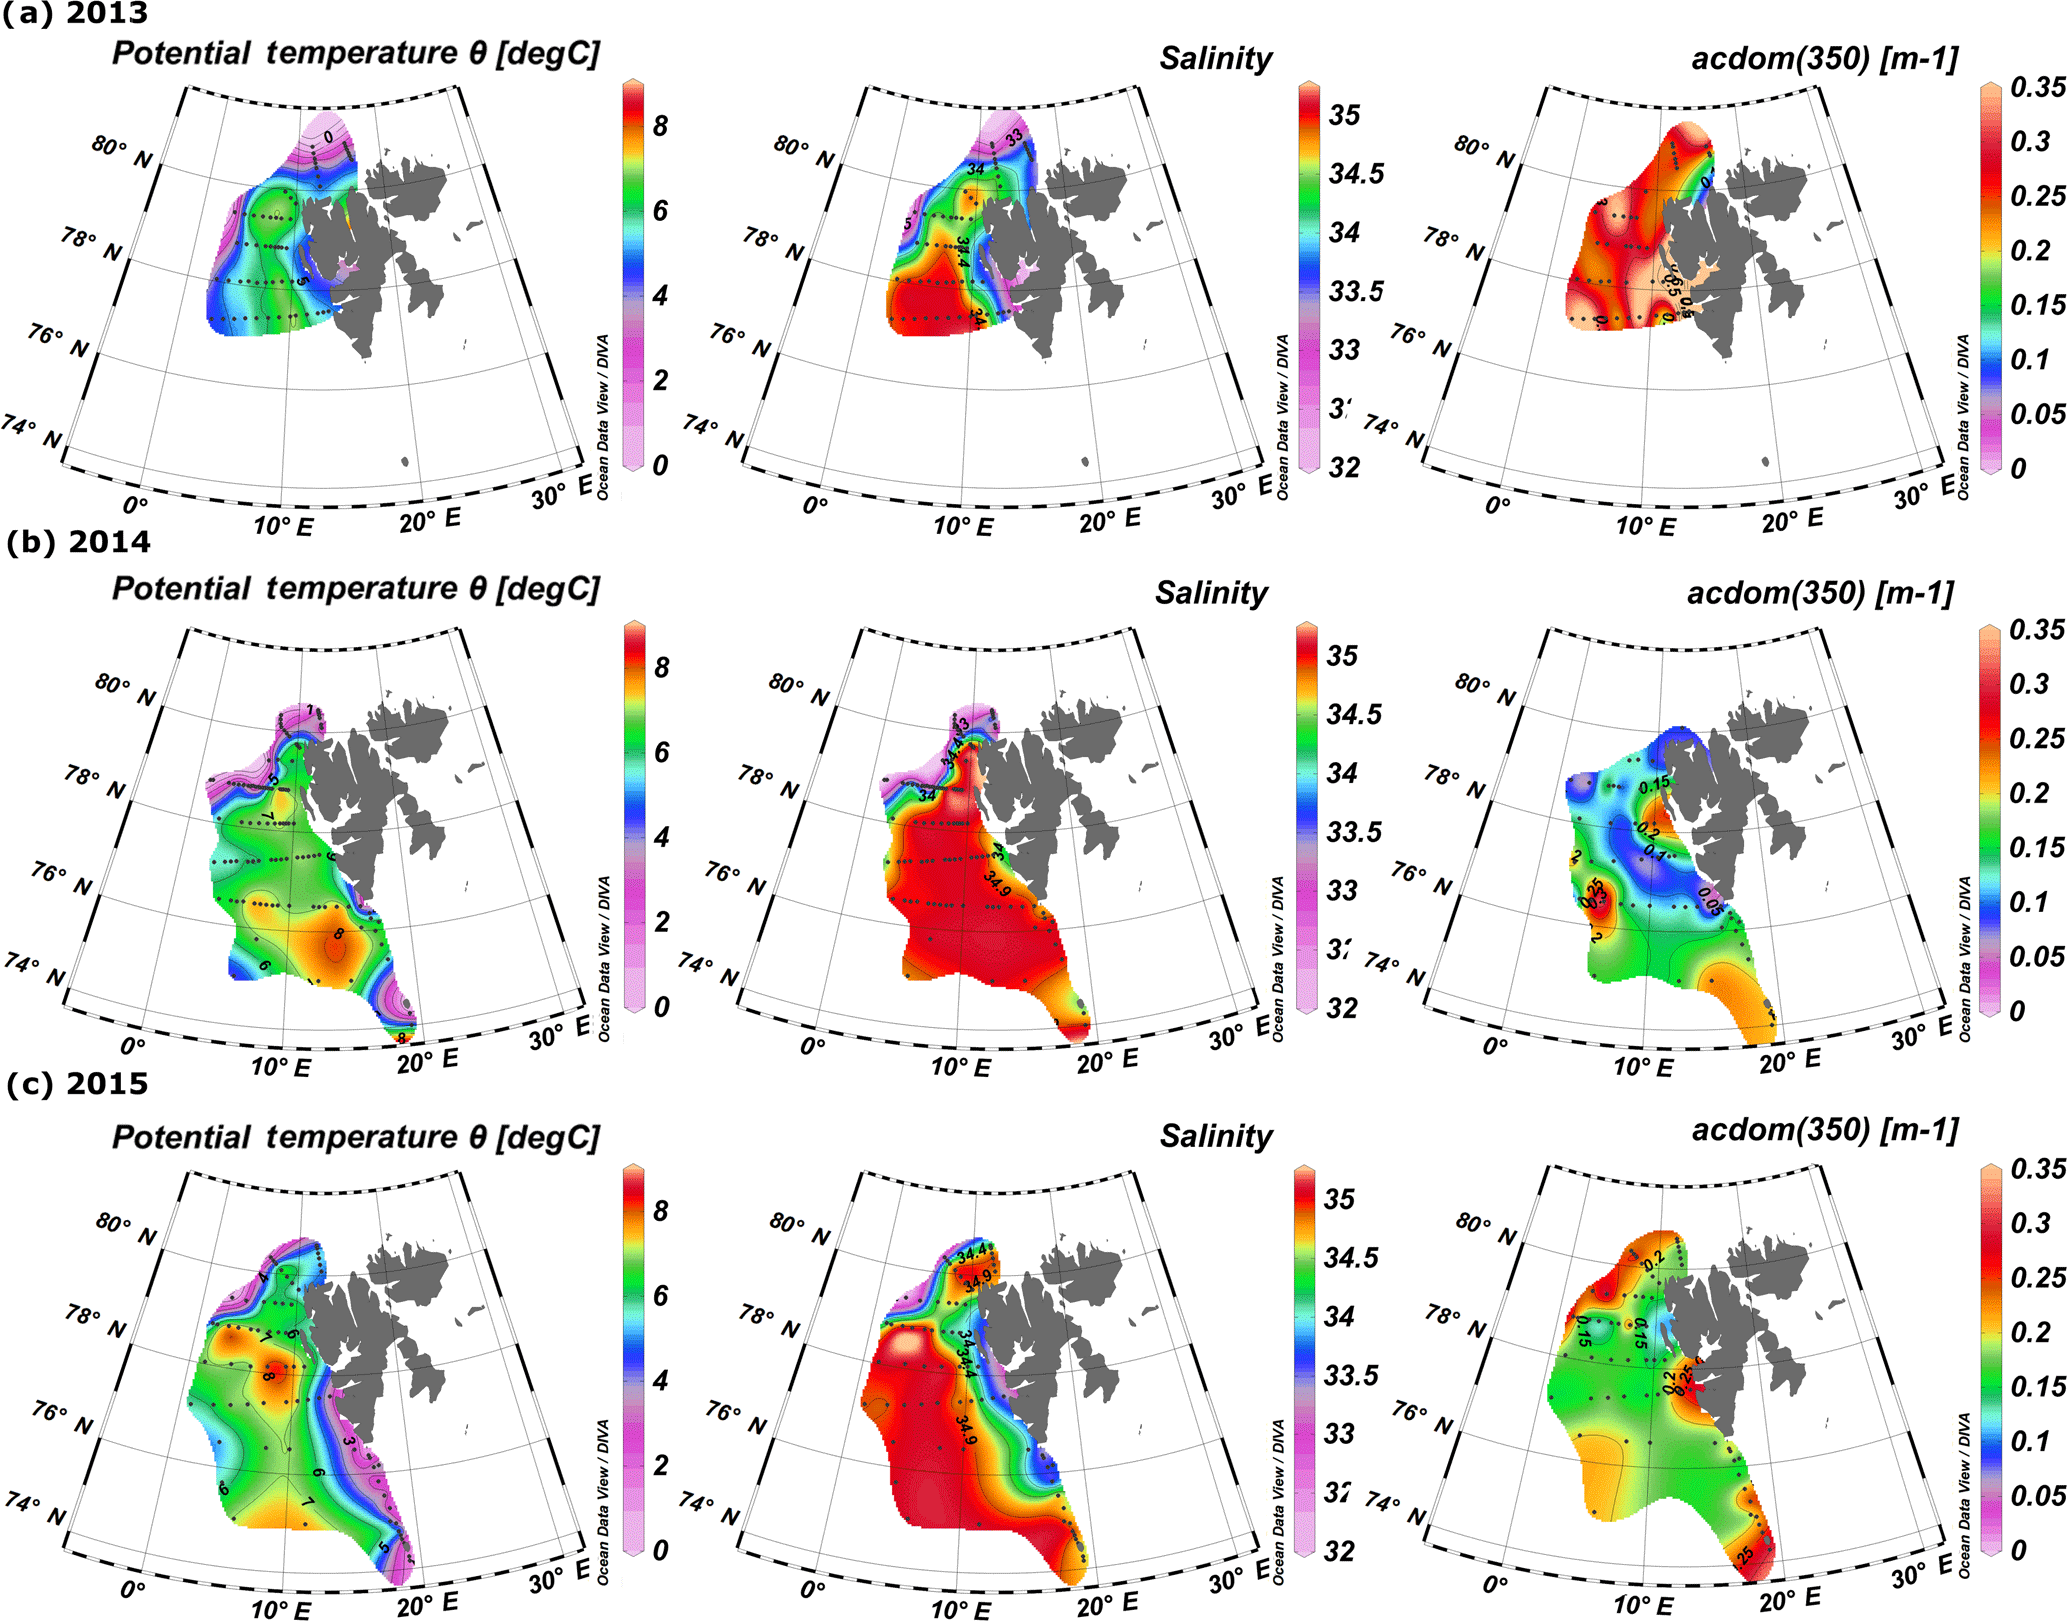
Figure 2Surface distribution of temperature, salinity, and aCDOM(350) in 2013–2015 (a–c, respectively). Plots were created with the use of Ocean Data View (Schlitzer, 2016).
3.1 Interannual and spatial variability in CDOM properties in surface waters with relation to hydrography
Spatial distribution of temperature, salinity, and aCDOM(350) in surface waters of the West Spitsbergen Shelf and Norwegian Sea shows considerable variation among years (Fig. 2). In 2013, the West Spitsbergen Shelf was under the influence of cold and low-salinity waters from SC. The impact of this current together with possible terrestrial runoff (the highest aCDOM(350) values were observed at Spitsbergen fjord entrances) was reflected in high aCDOM(350) (average 0.47 ± 0.26 m−1) for coastal waters on the West Spitsbergen Shelf. Lower values of aCDOM(350) were observed in the PSWw (average 0.33 ± 0.17 m−1) from coastal areas and in the warm and salty AW from the WSC (average 0.28 ± 0.07 m−1). The lowest CDOM absorption (average 0.25 ± 0.05 m−1) in 2013 was observed at the northernmost and northeasternmost stations influenced by low-salinity PSW affected by sea ice meltwater.
A quite different situation was observed in 2014 (Fig. 2b). The spatial extent of AW was distinctly wider, as shown by temperature and salinity distributions. The higher proportion of AW over the West Spitsbergen Shelf in 2014 was confirmed by the temperature and salinity time series in the top 200 m water layer (Walczowski et al., 2017). This large volume of AW influenced CDOM absorption, which was lowered to half of the values (average aCDOM(350) = 0.15 ± 0.06 m−1) compared to 2013. In addition, mean aCDOM(350) values around 0.1 ± 0.03 m−1 were observed in the northern Spitsbergen shelf in the area affected by sea ice melting (within the salinity range of 31.4–33.9).
In 2015, SC and ESC branches originating from the Barents Sea were pronounced, as indicated by lower temperature and salinity, Fig. 2c, resulting in elevated aCDOM(350) values on the West Spitsbergen Shelf and along the section from Sørkapp down to 74∘ N and near Bjørnøya Island. In 2015 AW was characterized by a low CDOM concentration (aCDOM(350) average 0.17 ± 0.02 m−1) in contrast to PSW observed north of Svalbard (average aCDOM(350) = 0.27 ± 0.05 m−1).
Summary statistics of the variability in aCDOM(350), aCDOM(443), S275–295, S300–600, (350), and SUVA254 in different water masses in a given year are provided in Table 2. The highest aCDOM(350) was observed in 2013 (Table 2) when CDOM absorption in AW and PSW was similar (average aCDOM(350) = 0.28 ± 0.07 m−1). CDOM absorption in PSWw was higher and was characterized by the greatest variability (average aCDOM(350) = 0.32 ± 0.16 m−1; min–max: 0.15–0.9 m−1 CV = 50 %; CV: coefficient of variation). In 2014 aCDOM(350) values were almost 2 times lower compared to other summer seasons (Table 2). In 2014 79 % of all samples were classified as AW (average aCDOM(350) = 0.14 ± 0.05 m−1), which corresponded to the highest temperature, widespread AW distribution, and lack of apparent influence by SC waters. Less than 15 % of samples represented PSWw (average aCDOM(350) = 0.14 ± 0.05 m−1) (Table 2). In 2015 we observed intermediate aCDOM(350) values in AW and PSWw (Table 2) with the highest values in PSW and AAW (PSW: aCDOM(350) = 0.26 ± 0.09 m−1; AAW: aCDOM(350) = 0.25 ± 0.06 m−1).
The spectral slope coefficient is often inversely nonlinearly related to the CDOM absorption coefficient (Stedmon and Markager, 2001; Stedmon et al., 2003; Kowalczuk et al., 2006; Meler et al., 2016). S275–295 and S300–600 were lowest in 2013 and highest in 2014, with intermediate values in 2015 (Table 2). The carbon-specific CDOM absorption coefficient (350) was significantly lower (p < 0.000001, T test) in 2014 compared to 2013 and 2015. The values of SUVA254 were most diverse in 2013 whereas the greatest variability in AW (min–max: 0.64–9.23 m2 gC−1) was observed in 2014. In 2014 and 2013 average values of SUVA254 for the whole season were similar, around 1.7 m2 gC−1 (Table 3); however average values in AW and PSWw were higher in 2013 and 2014, respectively (Table 2). In 2015 average SUVA254 values were similar within identified water masses and low variation (±0.15 m2 gC−1) among different waters was observed. The interannual variability in SUVA254 was insignificant (p = 0.89, T test) between 2013 and 2014; however the average SUVA254 values observed in 2015 were significantly different (p < 0.002, T test) than in 2013 and 2014 (Table 2).
The average DOC concentration in the study area was highest in 2013 (80.69 µmol L−1) and decreased significantly (p < 0.000001, T test) year by year (Table 3) to 67.64 µmol L−1 in 2015. The average chlorophyll a concentration was lowest in 2013 (0.87 mg m−3), almost doubled in 2014 (1.58 mg m−3), and decreased by 12 % in 2015 (1.39 mg m−3), relative to the previous year.
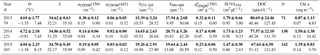
Table 2Descriptive statistics of selected parameters from AREX 2013–2015. Average and standard deviation (bold text), range of variability (min–max, below bold text) in depth, potential temperature (Θ), salinity (S), absorption coefficient at 350 nm (aCDOM(350)), absorption coefficient at 443 nm (aCDOM(443)), spectral slope coefficient in the range 275–295 nm (S275–295), and spectral slope coefficient in the range 300–600 nm (S300–600). Water masses were classified according to Rudels et al. (2005) with minor modifications (see Table S1).
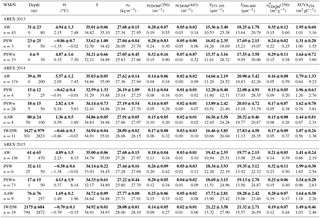
Table 3Yearly averaged descriptive statistics of selected CDOM optical properties from AREX 2013–2015. Average and standard deviation (bold text), range of variability (min–max, below bold text) in potential temperature (Θ), salinity (S), absorption coefficient at 350 nm (aCDOM(350)), absorption coefficient at 443 nm (aCDOM(443)), spectral slope coefficient in the range 275–295 nm (S275–295), spectral slope coefficient in the range 300–600 nm (S300–600), carbon-specific CDOM absorption coefficient ((350)), carbon-specific CDOM absorption coefficient at 254 (SUVA254), dissolved organic carbon (DOC), and chlorophyll a (Chla).
3.2 Optical properties of different water masses
All measured salinity and temperature values are presented in the TS diagram as a function of depth (Fig. 3a) to visualize water masses sampled during the AREX2013, AREX2014, and AREX2015 campaigns. The majority of measurement represented characteristics of AW that covered all depth ranges. The second water mass represented in our data set was low-density PSWw (σθ≤27.7 kg m−3), which was observed above 50 m depth. The smallest fraction of data points belonged to PSW, which was aggregated in the subsurface 20–70 m depth range, and AAW, which was encountered within the 50–100 m depth range (Fig. 3a). To visualize the distribution of DOM properties within classified water masses we have chosen the fluorescence intensity of the marine humic-like DOM (ICH1), fluorescence intensity of the protein-like DOM (ICH3), and CDOM absorption aCDOM(350). The highest ICH1 values were observed in PSW and the lowest in PSWw (Fig. 3b). Humic-like FDOM in AW was characterized by a large dynamic range and both low (320 RC) and high values (> 360 RC) were observed (Fig. 3b). In the case of ICH3 the highest values were observed in PSW, PSWw mid depth (15–50 m, which can be associated with chlorophyll a maximum), and in part of AW, which was separated from PSWw (upper part: T > 0, σθ≤27.7, S > 34.9). The lowest ICH3 values were observed in AW (lower part: 27.7 < σθ≤27.97) and in PSWw, where σθ≤26.5 (Fig. 3c). There was a large variability and no consistent trends in distribution of aCDOM(350) values in different water masses in the study area, as shown in the TS diagram (Fig. 3d). The distribution of fluorescence intensity of the terrestrial humic-like DOM (ICH2) and SUVA254 in the TS diagram is shown in the Supplement (Fig. S2).

Figure 3TS diagram of water mass distribution in the study area in 2013–2015. (a) Color bar represents depth (m). (b) Color bar represents humic-like fraction fluorescence intensity ICH1 (ex. = 310 nm and em. = 450 nm, RC). (c) Color bar represents protein-like fraction fluorescence intensity ICH3 (ex. = 280 nm and em. = 350 nm, RC). (d) Color bar represents values of absorption coefficient at 350 nm, aCDOM(350) (m−1). The lower number of points in (d) resulted from fewer numbers of discrete water samples for determination of CDOM. Water masses: AW (Atlantic Water), AAW (Arctic Atlantic Water), AIW (Arctic Intermediate Water), PSW (Polar Surface Water), and PSWw (Polar Surface Water warm). Three areas noted as AW follow the three sets of conditions that define AW (see Table S1).
3.3 Vertical distribution of FDOM components
The instrumental in situ synchronous IOP measurements enabled us to resolve FDOM distribution with better resolution, compared to coarser discrete water sampling of CDOM. Representative vertical profiles of temperature, salinity, FDOM, and chlorophyll a fluorescence are shown in Fig. 4. Differences in the vertical distribution of salinity and temperature (Fig. 4a, b) were observed at sampling stations located near the sea ice edge (black stars), where a cold and fresher surface layer (typically 5–10 m deep; classified as PSWw) was present. The salinity at stations located in the core of AW (green circles) and at the southwestern Spitsbergen shelf (red circles) was uniform in the upper 100 m (Fig. 4a, b). There was very little spatial and vertical variation in humic-like FDOM (ICH1 and ICH2). The only exception was the slightly higher, but still vertically homogenous, distribution of humic-like FDOM observed at stations near the Spitsbergen coast in 2014 (red dots; Fig. 4c, d).
The vertical distribution of protein-like FDOM (ICH3, Fig. 4e) was very similar to distribution of chlorophyll a fluorescence (IFChla, Fig. 4f) and the total non-water absorption coefficient at 676 nm (atot−w(676), Fig. 4g). All three parameters had a strong subsurface maximum at the depth range between 10 and 30–40 m and similar spatial distribution. The surface values for these three parameters were higher than values below the maximum (40 m) for profiles in the AW (green and red symbols). Near the ice edge, however, stations were characterized by lower values in the surface layer, comparable to the values below 40 m, likely due to dilution of FDOM and Chla by sea ice meltwater at the very surface. The atot−w(676) vertical profiles in AW were different, with elevated values throughout the whole upper layer (0–30 m depth), which dropped sharply to a background level below the subsurface chlorophyll a maximum.

Figure 4Vertical profiles of salinity (a), temperature (b), and different FDOM components: marine humic-like FDOM (ICH1, c), terrestrial humic-like fraction of DOM (ICH2, d), protein-like FDOM (ICH3, e), chlorophyll a fluorescence (IFChla, f), and total non-water absorption coefficient at 676 nm (atot−w(676), g) in 2014. Red dot, green square, and black star symbols correspond to vertical profiles obtained over the West Spitsbergen Shelf (influenced by SC), in the core of the WSC, and near the ice edge (with a presence of PSWw in the surface 0–20 m layer), respectively.
3.4 Relationship between chlorophyll a and protein-like FDOM
The qualitative correspondence between fluorescence of protein-like FDOM and chlorophyll a fluorescence intensity (Fig. 4) has been quantitatively confirmed by regression analysis. A significant positive relationship between ICH3 and IFChla was found in both 2014 and 2015 (R2 = 0.65, p < 0.0001, n = 24 490; Fig. 5a). The relationship was stronger in 2014 (R2 = 0.75, p < 0.0001, n = 17 700; blue line in Fig. 5a), when broader influence of AW was observed (Walczowski et al., 2017), than in 2015 (R2 = 0.45, p < 0.0001, n = 7290; red line in Fig. 5a).
The same relationship was confirmed using data from discrete water samples. A statistically significant relationship between ICH3 and Chla values was found in both years, and the determination coefficient for the combined data set was R2 = 0.36 (p < 0.0001) (Fig. 5b). There was higher correlation observed between ICH3 and Chla values in 2015 compared to 2014 (Fig. 5b). Higher dispersion between FDOM fluorescence intensity measured in situ and chlorophyll a measured in water samples could be a result of the time lag between instrumental measurements and water collection that reached up to 1.5 h. The IOP instruments' deployment was usually performed simultaneously with CTD downcast, while water sample collection was performed during CTD rosette upcast, which was significantly delayed especially at deep water stations (at sampling stations located at a water depth > 1000 m). Observed higher protein-like FDOM values per chlorophyll a concentration unit could be explained by phytoplankton physiological response due to higher water temperature observed in 2014 and consequently more efficient extracellular DOM release. This physiological effect is evident in relationships between chlorophyll a fluorescence and atot−w(676). In 2014 phytoplankton were more fluorescent at the same absorption level (Fig. S3).
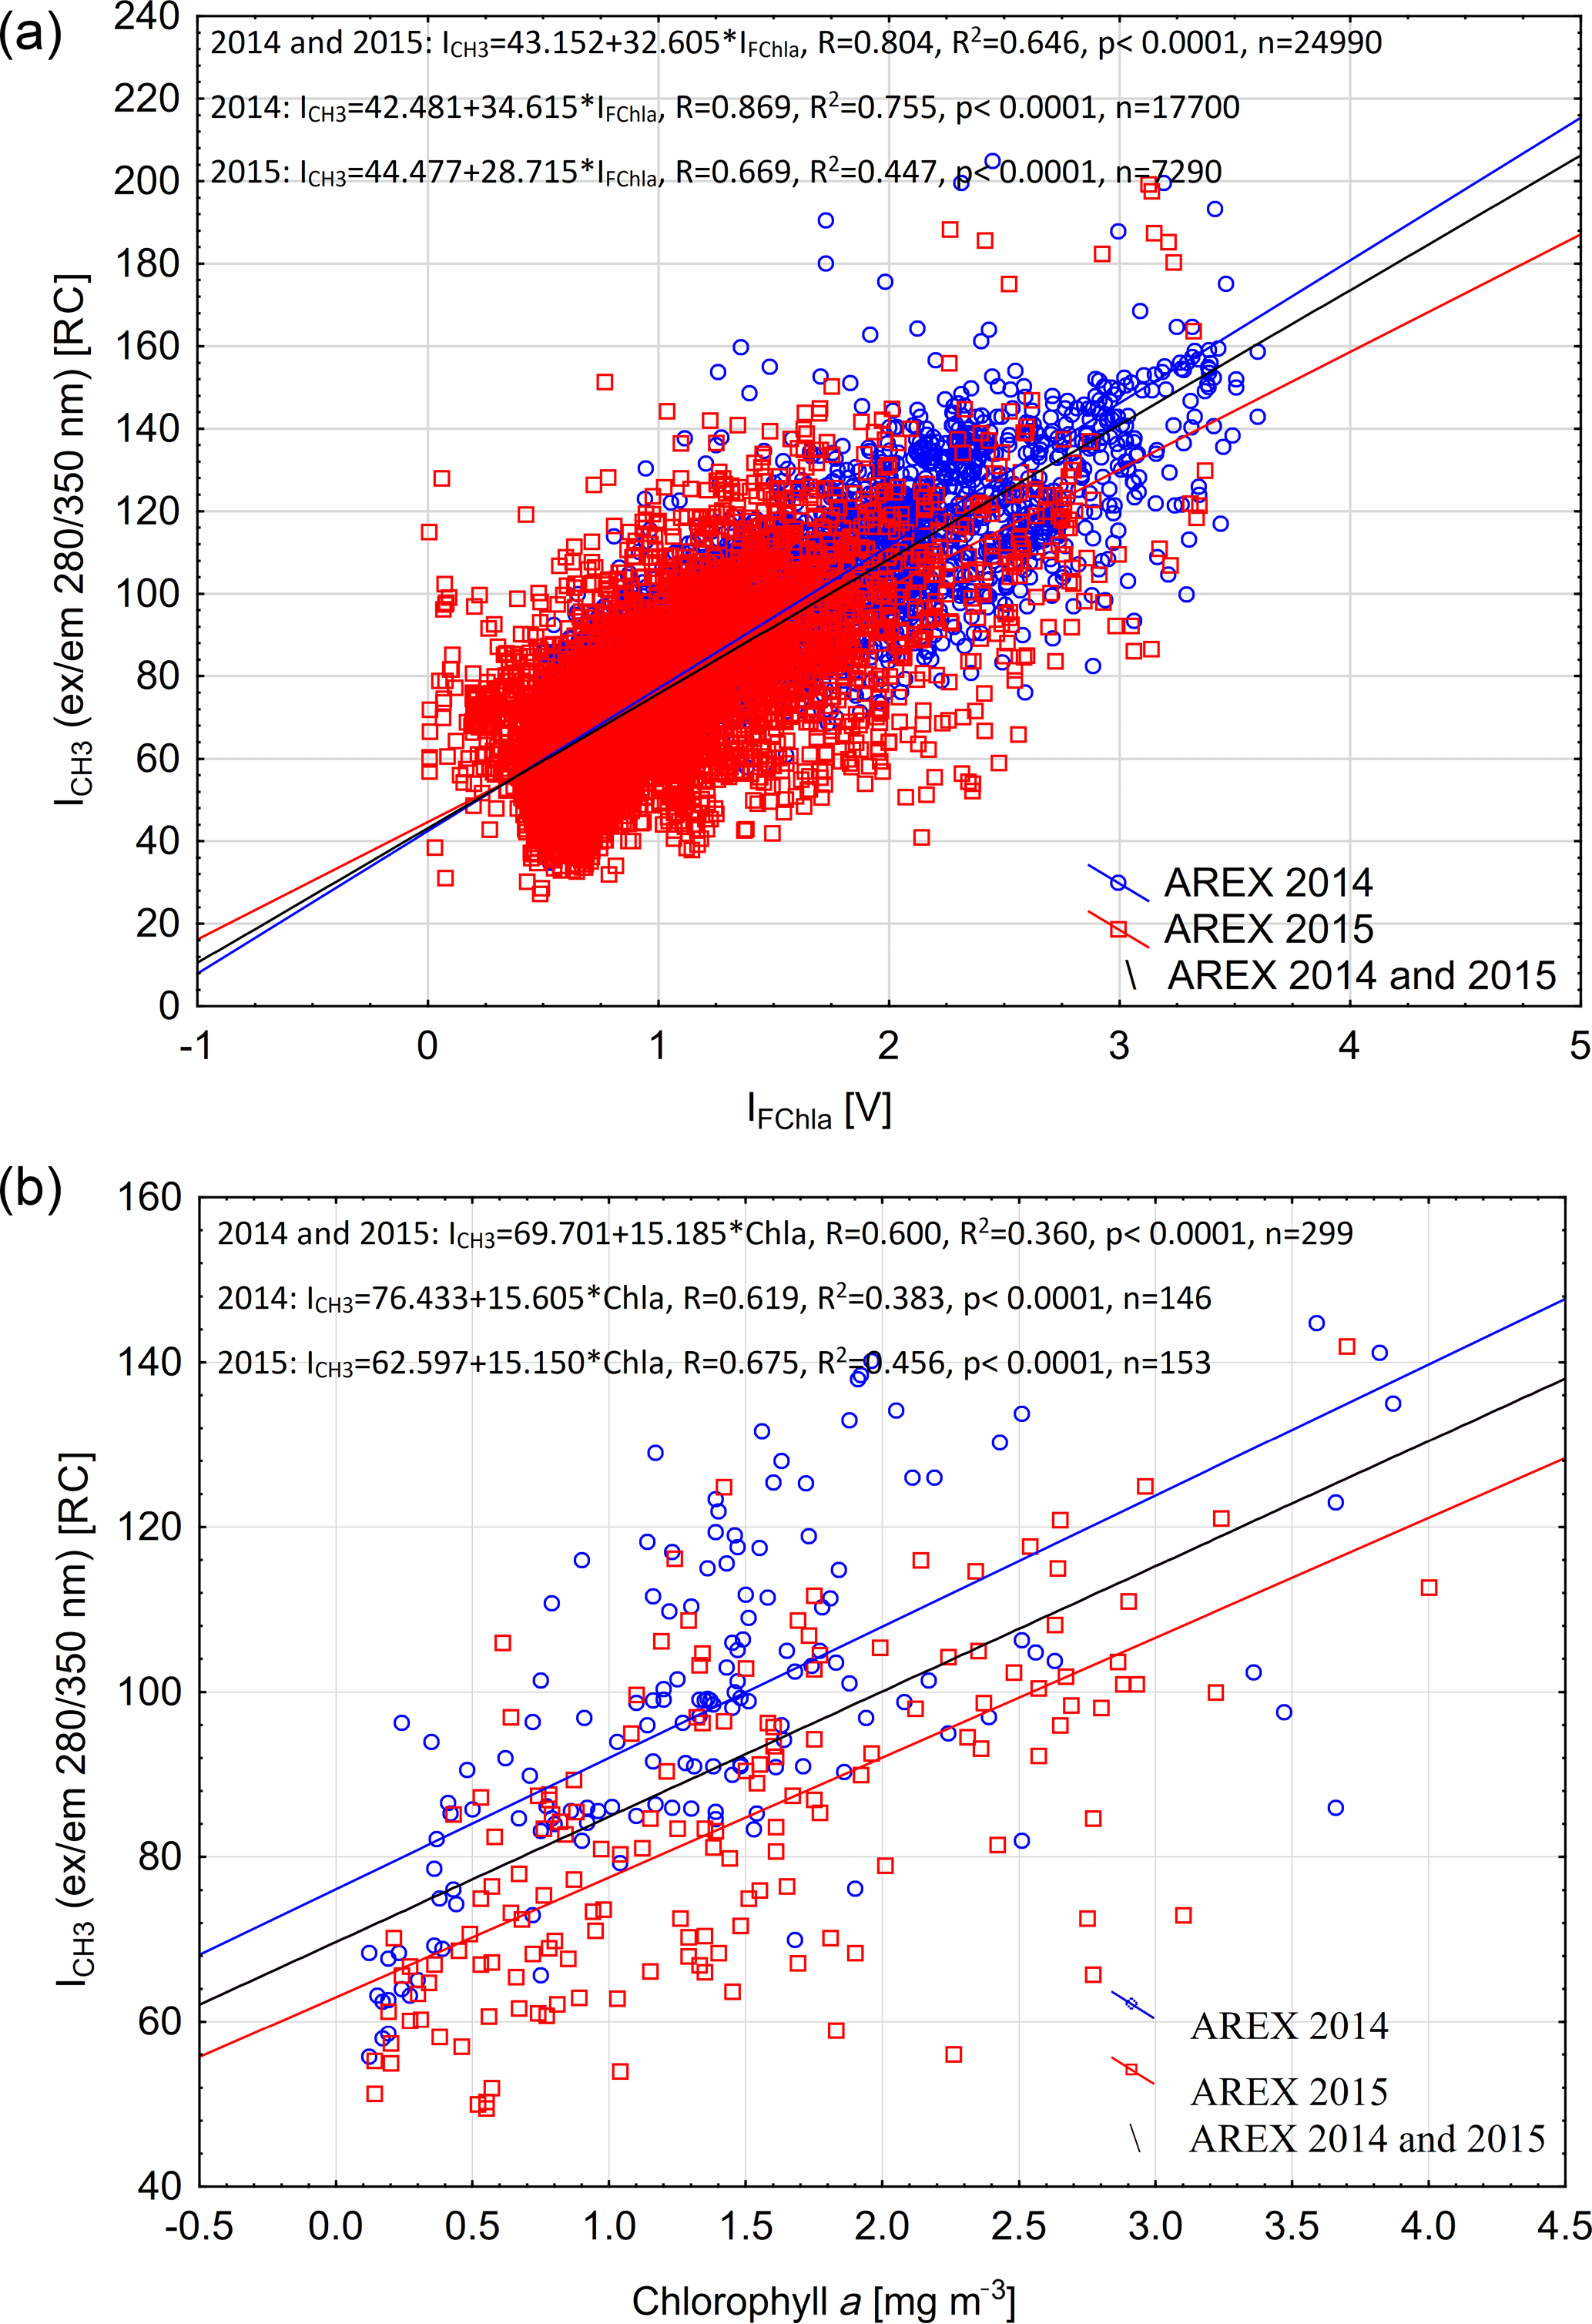
Figure 5Relationship between chlorophyll a fluorescence (IFChla) and fluorescence of the protein-like component (ICH3) (a) and relationship between fluorescence of the protein-like component (ICH3) and chlorophyll a concentration from discrete water samples (b) in the upper 200 m of the water column in 2014 and 2015. Set of linear regression functions, correlation coefficient (R), coefficient of determination (R2), p value, and number of samples (n) are presented in Fig. 5.
4.1 Variability in and spectral properties of CDOM in the Nordic Seas
The highest CDOM absorption in the Arctic has been observed in coastal margins along the Siberian Shelf in the Laptev Sea, close to the Lena River delta (aCDOM(440) = 2.97 m−1 salinity close to 0) (Gonçalves-Araujo et al., 2015) and in Laptev Sea shelf water at the surface (aCDOM(443) > 1 m−1, salinity < 28) (Gonçalves-Araujo et al., 2018) and at the coast of the Chukchi Sea and southern Beaufort Sea influenced by riverine inputs of the Yukon and Mackenzie rivers (aCDOM(440) > 1 m−1, salinity < 28) (Matsuoka et al., 2011, 2012; Bélanger et al., 2013). Exceptionally high CDOM absorption has also been observed in the southern part of Hudson Bay near river outlets with aCDOM(355) > 15 m−1, at a salinity close to 0 (Granskog et al., 2007). Pavlov et al. (2016) reported aCDOM(350) of up to 10 m−1 at a salinity of 21 in surface waters of the White Sea. Terrestrial CDOM from the Siberian Shelf has been diluted and aCDOM(440) decreased to ca. 0.12 m−1 at salinities of 32.6 (Gonçalves-Araujo et al., 2015) and transported further toward the Fram Strait by the Transpolar Drift, being gradually diluted or removed (Stedmon et al., 2011; Granskog et al., 2012). In the Transpolar Drift and the central Arctic Ocean, CDOM absorption in surface waters was dominated by terrestrial sources with observed aCDOM(443) values varying between ∼ 0.15 m−1, at salinities close to ±27 (Lund-Hansen et al., 2015), and ∼ 0.5 m−1 at a salinity range from 26.5 to 29.5 (Gonçalves-Araujo et al., 2018). Dilution also effectively decreased CDOM absorption in the western Arctic Ocean, and average CDOM absorption in the Chukchi Sea and Beaufort Sea was aCDOM(440) = 0.046 m−1, at salinities > 32.3 (Matsuoka et al., 2011, 2012; Bélanger et al., 2013). The influence of transformed AW generated in the Barents and Norwegian seas had impacted aCDOM(443) values in the Beaufort Gyre and Amundsen and Nansen basins, causing its decrease below 0.2 m−1 as reported by Gonçalves-Araujo et al. (2018).
The reported lower range of aCDOM(350) observed in AW during AREX2014 (2014: 0.14 ± 0.06 m−1) is in good agreement with data from the eastern part of Fram Strait at the 79∘ N section reported by Granskog et al. (2012), Stedmon et al. (2015), and Pavlov et al. (2015) and with data reported by Hancke et al. (2014) south of the Polar Front in the Barents Sea. Kowalczuk et al. (2017) observed similar aCDOM(350) values north of Svalbard. Higher values of CDOM absorption in AW observed in 2015 were within the published variability range (Pavlov et al., 2015; Hancke et al., 2014; Kowalczuk et al., 2017). The highest aCDOM(350) values in AW in 2013, 0.28 ± 0.07 m−1 (Table 2), were similar to Hancke et al. (2014) north of the Polar Front in the Barents Sea. Very low values of aCDOM(443) aligned with previous reports: in the core AW in the Greenland Sea measured during TARA expedition in 2013 (Matsuoka et al., 2017), in the eastern Fram Strait (Pavlov et al., 2015), in the Barents Sea (Hancke et al., 2014), and north of Svalbard (Kowalczuk et al., 2017). It should be underlined that data comparison could be biased by the number of observations, as this study documented aCDOM(350) and aCDOM(443) statistics based on a significantly higher number of samples and wider spatial coverage compared to the sources cited above.
The AW inflow with the WSC is an extension of the NAC originating from the Atlantic Ocean, and CDOM absorption presented in this study was comparable with values found in the North Atlantic Ocean (Kowalczuk et al., 2013; Kitidis et al., 2006). In contrast, values of absorption coefficients were 2 times higher in Norwegian coastal waters, which are influenced by the Lofoten Gyre, and presumably by terrestrial runoff as reported by Nima et al. (2016).
Despite lower-salinity and lower-temperature, CDOM optical properties in PSW in this study did not differ significantly from AW in 2013 and 2015, and similar variability ranges of CDOM properties were mentioned by Pavlov et al. (2017) north of Svalbard. Therefore, PW in the eastern Fram Strait has not been advected from the central Arctic Ocean, as in the EGC (Granskog et al., 2012; Pavlov et al., 2015), but rather it is a modified AW, strongly affected by heat loss and diluted by sea ice melt in the Barents Sea. Similar processes also occur on the northern Spitsbergen shelf, where PW was also found near the ice edge in surface waters diluted and cooled by sea ice melt.
According to Aas and Høkedal (1996) freshwater runoff from different sources influence Svalbard waters and there is no universal relation between salinity and CDOM in this area. Average values of aCDOM(350) in 2014 in PSW (Table 2) were similar to Arctic waters north of the Polar Front in the Barents Sea described by Hancke et al. (2014) and slightly higher than observed in this study in 2013 (0.32 ± 0.16 m−1) and 2015 (0.26 ± 0.09 m−1). According to Hancke et al. (2014) the CDOM pool in the Barents Sea was predominantly of marine origin, while several studies show terrestrial CDOM in the PW of the EGC (Granskog et al., 2012; Pavlov et al., 2015), and aCDOM(350) reported for PW in the EGC was significantly higher, by a factor of 2, than values reported in this study around Svalbard.
CDOM absorption in WSC reported by Pavlov et al. (2015) and our observations enabled us to observe significant interannual variability in aCDOM(350) since 2009 until 2015. The year-to-year changes in average aCDOM(350) may differ in AW by as much as 200 % (Table 2). We link these changes with intensity of AW transport to the West Spitsbergen Shelf presented as spatially and vertically average salinity and temperature time series (Walczowski et al., 2017). According to this study the average temperature north of 74∘ N was higher in 2009 than in 2010 and corresponded to lower aCDOM(350) in 2009 relative to 2010 (Pavlov et al., 2015). Similarly in 2013, with the highest CDOM absorption in our observations, the temperature was lower than in 2014 and 2015 (Walczowski et al., 2017). The average salinity of 35.05 reported in 2014 by Walczowski et al. (2017) was close to the record high of 35.08 measured in the period 2000–2016. In 2014 we observed the lowest aCDOM(350) reported since 2009.
S300–600 varied very little between water masses in a given season (Table 2); thus we assume that average seasonal values are representative for all water masses (Table 3). The largest variation in S300–600 (Fig. 6, Table 3) was observed in 2014, while the lowest variation in this parameter and a shift towards lower values was observed in 2013 and 2015. Spectral slope coefficient values (19.0 ± 2.7 µm−1) reported by Granskog et al. (2012) for AW across a section in the eastern Fram Strait were very similar to those found during AREX2013 and AREX2015 (Table 2). Spectral slopes presented by Granskog et al. (2012), however, were calculated in the broader spectral range 300–650 nm, while Hancke et al. (2014) calculated a spectral slope coefficient in the narrower spectral range of 350–550 nm. Recalculation of the spectral slope coefficient for our data set in the spectral range 300–650 nm resulted in an average increase in S by < 1 µm−1 relative to S300–600. The spectral slope reported by Hancke et al. (2014) varied among seasons; values in May 2008 (16 ± 4 µm−1) were higher than those observed in August 2007 (14 ± 4 µm−1) but both were similar to values reported in this study. Although Hancke et al. (2014) calculated spectral slope coefficient for a narrower spectral range, resulting consistently in lower spectral slope values by ∼ 2 µm−1, their values were within the range of S300–600 in the current data set. In the WSC the S300–600 values were higher than those for surface waters north of Svalbard in winter–spring reported by Kowalczuk et al. (2017). Observations reported by Kowalczuk et al. (2017) were conducted earlier in the season and samples were collected below sea ice; thus CDOM was less exposed to solar radiation and was potentially less affected by photobleaching. The highest S300−600 values were found during AREX2014 (20.71 ± 5.26 µm−1), when over 79 % of samples were classified as AW, which could be associated with photomineralization of DOM in aging seawater (Obernosterer and Benner, 2004).
4.2 Identification of CDOM sources
According to Stedmon and Markager (2001) the nonlinear relationship between spectral slope S300–600 and aCDOM(375) allows the differentiation between terrestrial (allochthonous) and marine (autochthonous) CDOM pools as well as the assessment of changes in CDOM composition. This approach was validated by Granskog et al. (2012), who found that CDOM samples taken in PW with high fractions of meteoric water (i.e., river water) in the western part of Fram Strait were outside the Stedmon and Markager (2001) model limits for marine CDOM. Increasing spectral slopes and decreasing CDOM absorption provides information about degradation of autochthonous CDOM originated from marine environments (Stedmon and Markager, 2001; Whitehead and Vernet, 2000). We found decreasing S300–600 values with increasing CDOM absorption in all three years (Fig. 6). This is similar to that presented by Kowalczuk et al. (2006) in the Baltic Sea and Pavlov et al. (2014) in Kongsfjorden, West Spitsbergen. In our study almost all data points are within the Stedmon and Markager (2001) model limits (Fig. 6) and suggest a dominant marine (autochthonous) source of CDOM. The highest S300–600 (> 25 µm−1) with very low CDOM absorption (< 0.075 m−1) suggests a highly degraded CDOM pool in 2014. In contrast, lower values of S300–600 (< 18 µm−1) with higher absorption (> 0.15 m−1) could indicate freshly produced CDOM. Lack of correlation between salinity and aCDOM(λ) was found here (not shown) as by Hancke et al. (2014), which further suggests a marine origin of organic matter in the study area.
There were some data points, measured in 2013 characterized by absorption (> 0.25 m−1) and a spectral slope of ∼ 18 µm−1 that were outside the upper Stedmon and Markager (2001) model limits. These points could bias the S300–600 and aCDOM(375) relationship derived for the present data set, and suggest either a more terrestrial contribution at high aCDOM(375) from local sources or the influence of polar water in the western part of the Fram Strait or recirculating modified AW. A slight increase in humic-like DOM fluorescence (ICH1 and ICH2), observed near the southwestern Spitsbergen shelf (Fig. 4), could indicate a small local contribution from a terrestrial CDOM source.
The presumed molecular structure of marine autochthonous DOM is composed mainly with low-molecular-weight aliphatic organic compounds characterized by low saturation with aromatic rings (Harvey et al., 1983). SUVA254 defined by Weishaar et al. (2003) is related to aromatic ring content within the mixture of water-soluble organic DOM. Massicotte et al. (2017) presented the global distribution of SUVA254 and found that SUVA254 decreased sharply in the aquatic continuum from fresh (4.8 m2 gC−1) to oceanic waters (1.68 m2 gC−1). SUVA254 also decreases with increasing salinity, decreasing rapidly in the salinity range of 0–8.7, remaining stable at salinity of 8.7–26.8, and decreasing slowly until salinity reaches oceanic values, and further remaining at a stable level of ca. 1.7 m2 gC−1 (Massicotte et al., 2017). SUVA254 values presented in this study (Table 2) were at the lower end of the global range, close to the oceanic end-member values. The highest average SUVA254 values were found in PSWw in 2013 (1.95 ± 0.60 m2 gC−1) and PSW in 2014 and 2015 (1.96 ± 0.63 and 1.99 ± 0.30 m2 gC−1, respectively) and the lowest in PSW (1.31 ± 0.28 m2 gC−1) and AW (1.41 ± 0.24 m2 gC−1) in 2013 and 2015, respectively. Pavlov et al. (2016) reported SUVA254 values at a salinity > 34.3 in the southern Barents Sea waters in the range of 1.3–1.8 m2 gC−1, which agree well with our findings. The SUVA254 values observed in the Siberian Shelf at a salinity > 30 varied between 1.25 and 2.3 m2 gC−1 (Gonçalves-Araujo et al., 2015). Low SUVA254 values suggested overall low saturation of CDOM with aromatic rings, which supports the hypothesis of predominantly autochthonous CDOM origin and minor influence by terrestrial DOM in the Nordic Seas, with hydrography dominated by AW inflow.
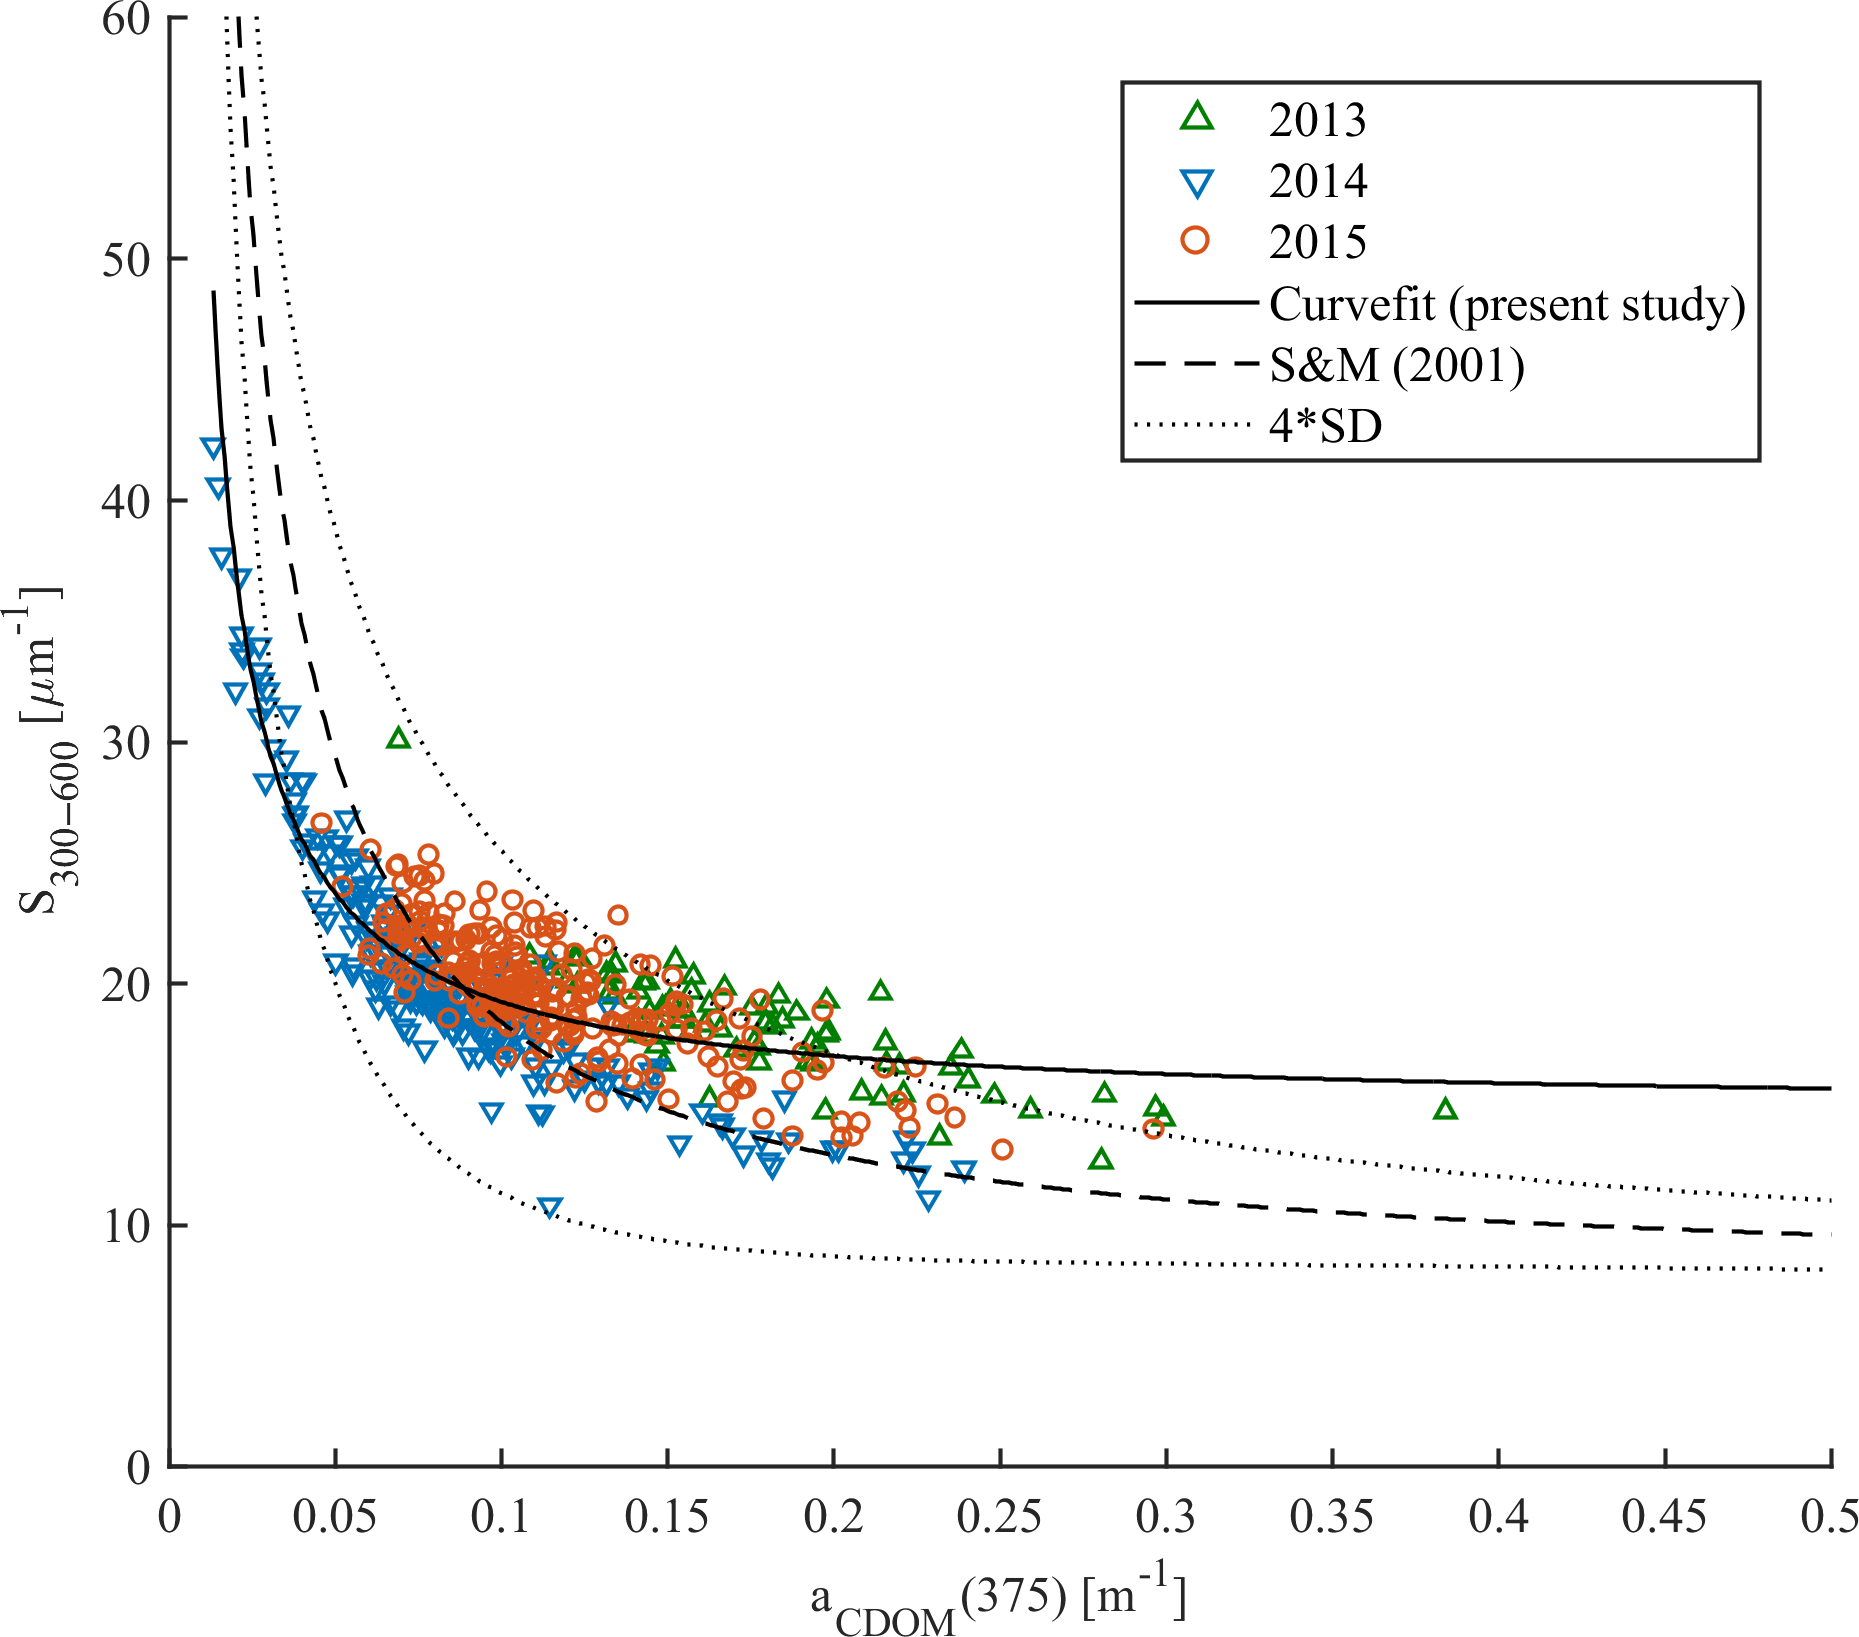
Figure 6Spectral slope S300–600 vs. aCDOM(375) in samples from 2013 (green triangles), 2014 (blue reversed triangles), and 2015 (red circles). The Stedmon and Markager (2001) model (dashed line) with model limits (±4 standard deviation times the precision of the S estimate; dotted line) adopted from the equation (375). The solid line represents the modeled nonlinear fit for the present study data set.
4.3 Relationship between CDOM absorption and DOC
The significant amount of DOC in the Arctic Ocean mainly originates from riverine inflow and permafrost thaw (Stedmon et al., 2011; Amon et al., 2012; Spencer et al., 2015). The riverine input can be monitored by optical methods with absorption, fluorescence, or remote-sensing measurements (Spencer et al., 2012; Walker et al., 2013; Fichot et al., 2013; Mann et al., 2016). The largest DOC concentrations were found in the Siberian rivers Lena – 1300 µmol L−1, Yenisey – 842 µmol L−1, and Ob – 950 µmol L−1, and the concentrations were lower in the North American Yukon – 816 µmol L−1 and McKenzie – 648 µmol L−1 rivers (Amon et al., 2012; Mann et al., 2016). Both CDOM and DOC in coastal areas in the Arctic Ocean show an inverse relationship with salinity (Amon et al., 2012) and a very good correlation between CDOM absorption and DOC has been reported for regions influenced by riverine input (Matsuoka et al., 2012, 2013; Gonçalves-Araujo et al., 2015; Pavlov et al., 2016; Mann et al., 2016). The DOC concentration observed by Amon et al. (2003) in the EGC in the western part of Fram Strait and in the Denmark Strait was considerably lower and ranged from 76 µmol L−1 in PSW to 55 µmol L−1 in AW. Amon et al. (2003) found a weak inverse relationship between DOC and salinity in the Nordic Seas and a weak correlation between DOC and CDOM fluorescence. The DOC concentration reported in this study in the AW-dominated eastern part of Fram Strait was similar to that reported by Amon et al. (2003) in the EGC but lower than found in Barents Sea waters entering the White Sea at salinities close to 34.9 (Pavlov et al., 2016). The DOC concentration in the open Laptev Sea was over 100 µmol L−1 as reported by Gonçalves-Araujo et al. (2015). We observed a very weak correlation between DOC concentration and aCDOM(350) (Fig. 7). That could be explained by the low number of samples influenced by terrestrial humic substances in our data, which have elevated aCDOM(350), DOC, and lower salinity. Additionally, our data were at the lower range of the globally observed distribution of DOC and aCDOM(350), where the relationship is characterized by large uncertainty (Massicotte et al., 2017).
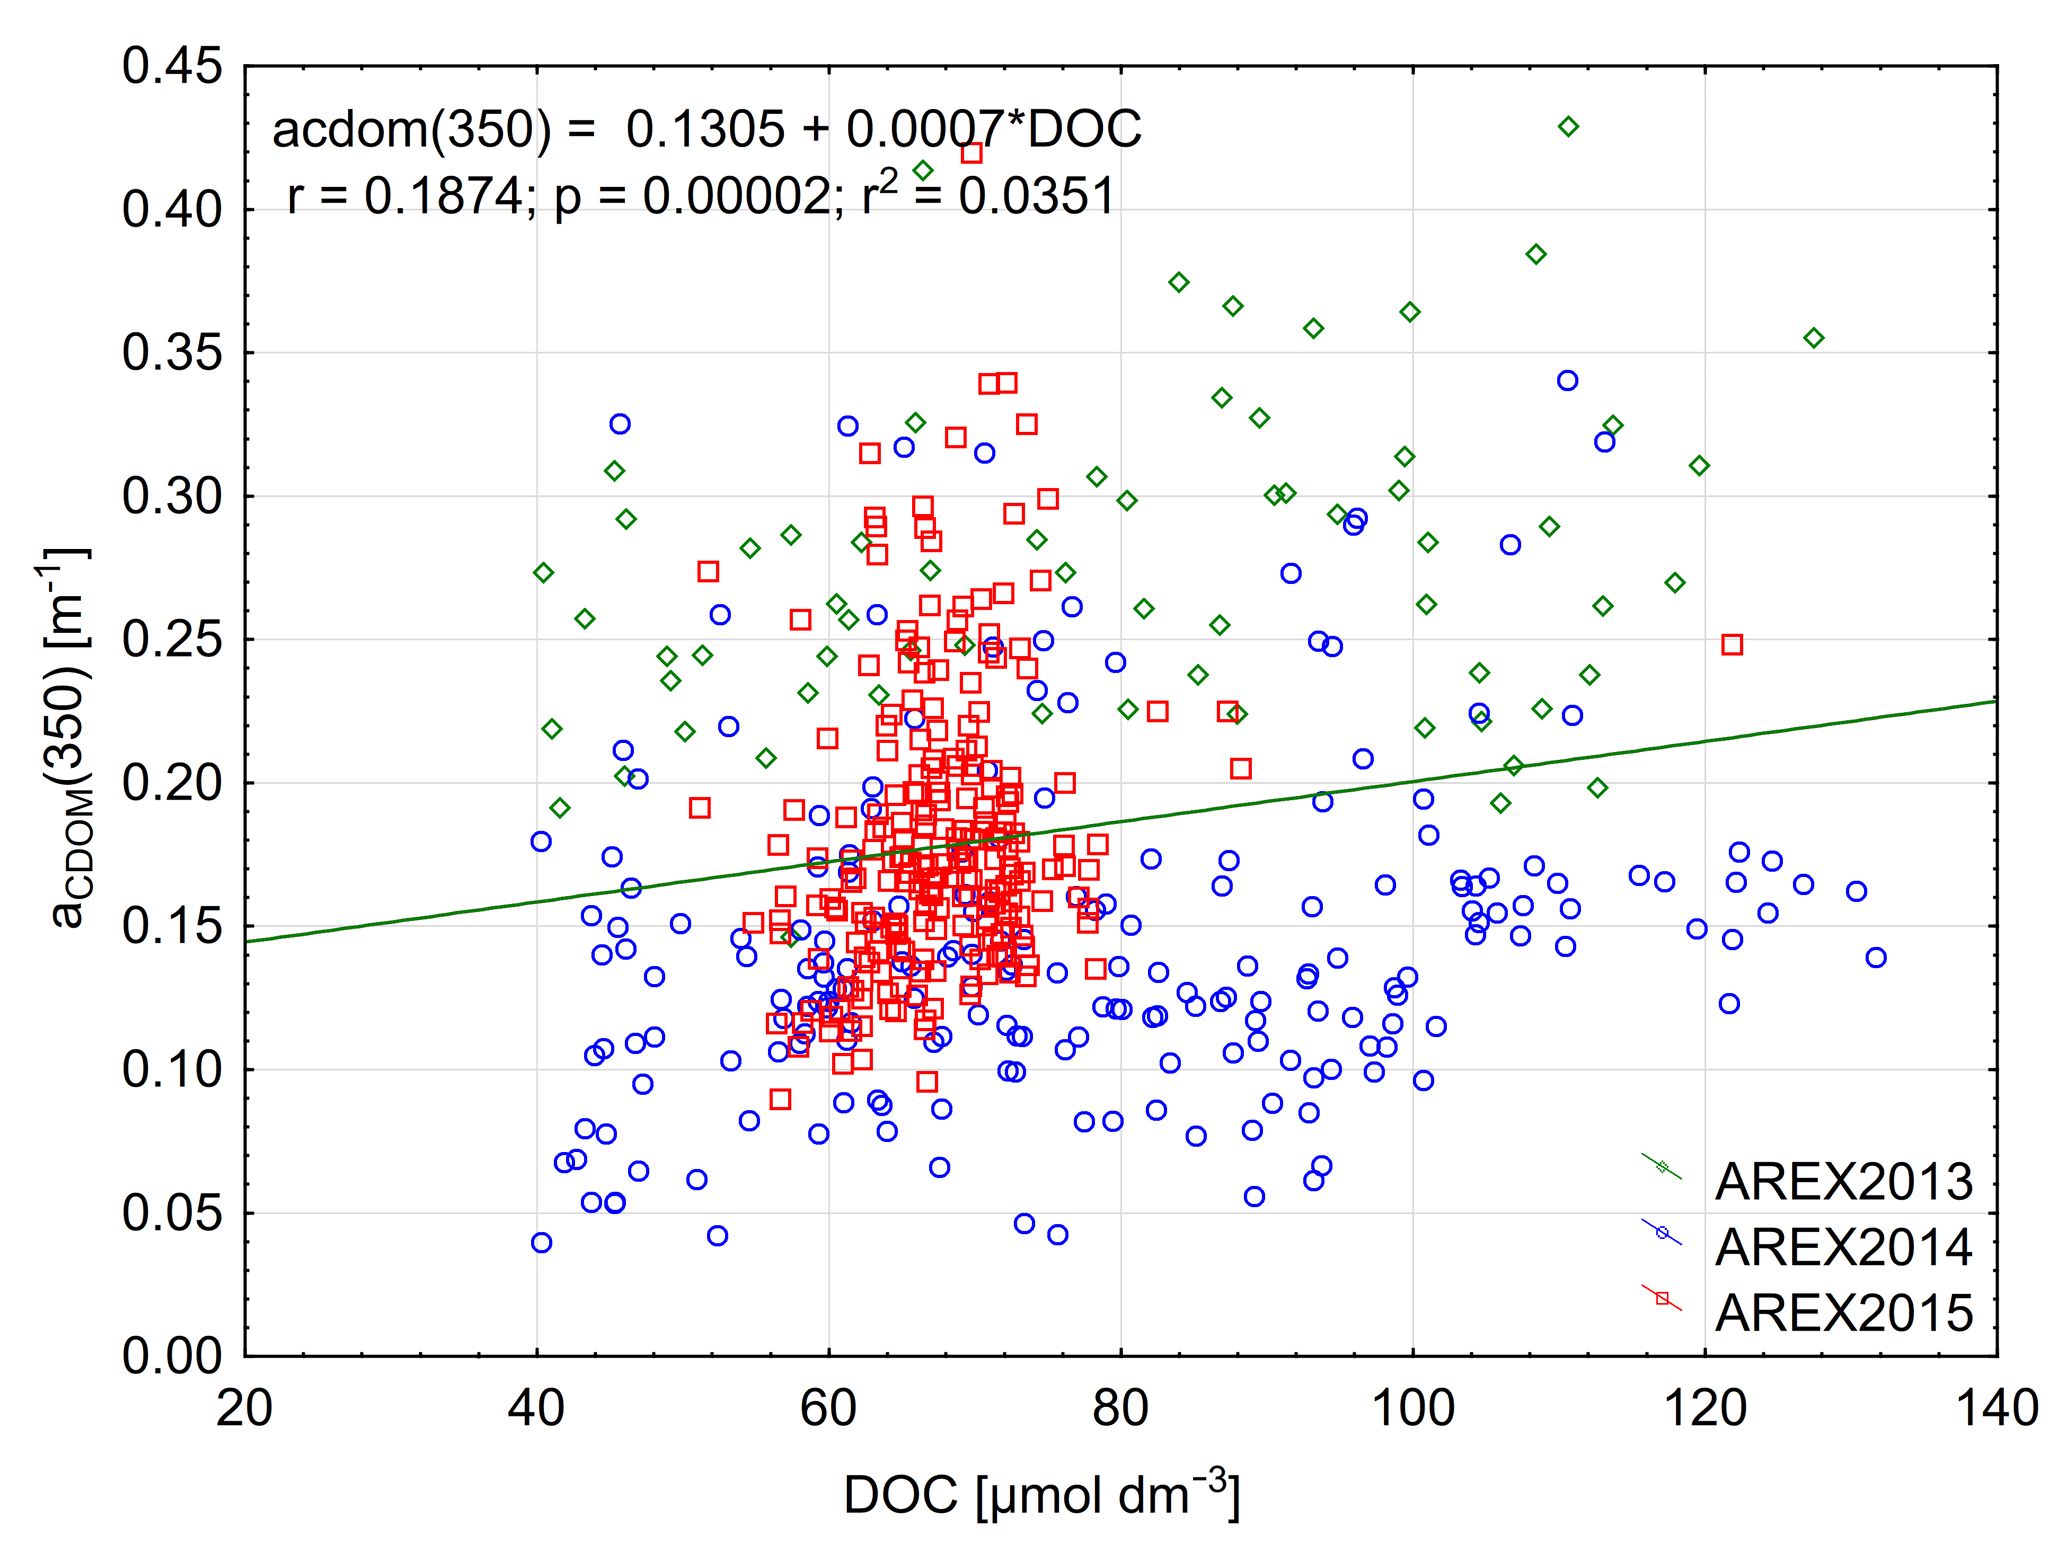
Figure 7Relationship between aCDOM(350) and DOC and linear relationship between those parameters in 2013–2015.
The relationship between the carbon-specific CDOM absorption coefficient (350) and S275–295 was another approach suggested by Fichot and Benner (2011, 2012) in the Gulf of Mexico to trace the influence of terrigenous DOC in coastal margins and to estimate DOC from optical measurements. We did not observe a significant relationship between (350) and S275–295 (not shown). However, (350) as a function of S300–600 showed much more promise (Fig. 8). This could be potentially applied for DOC estimations from CDOM absorption measurements in Nordic Seas.
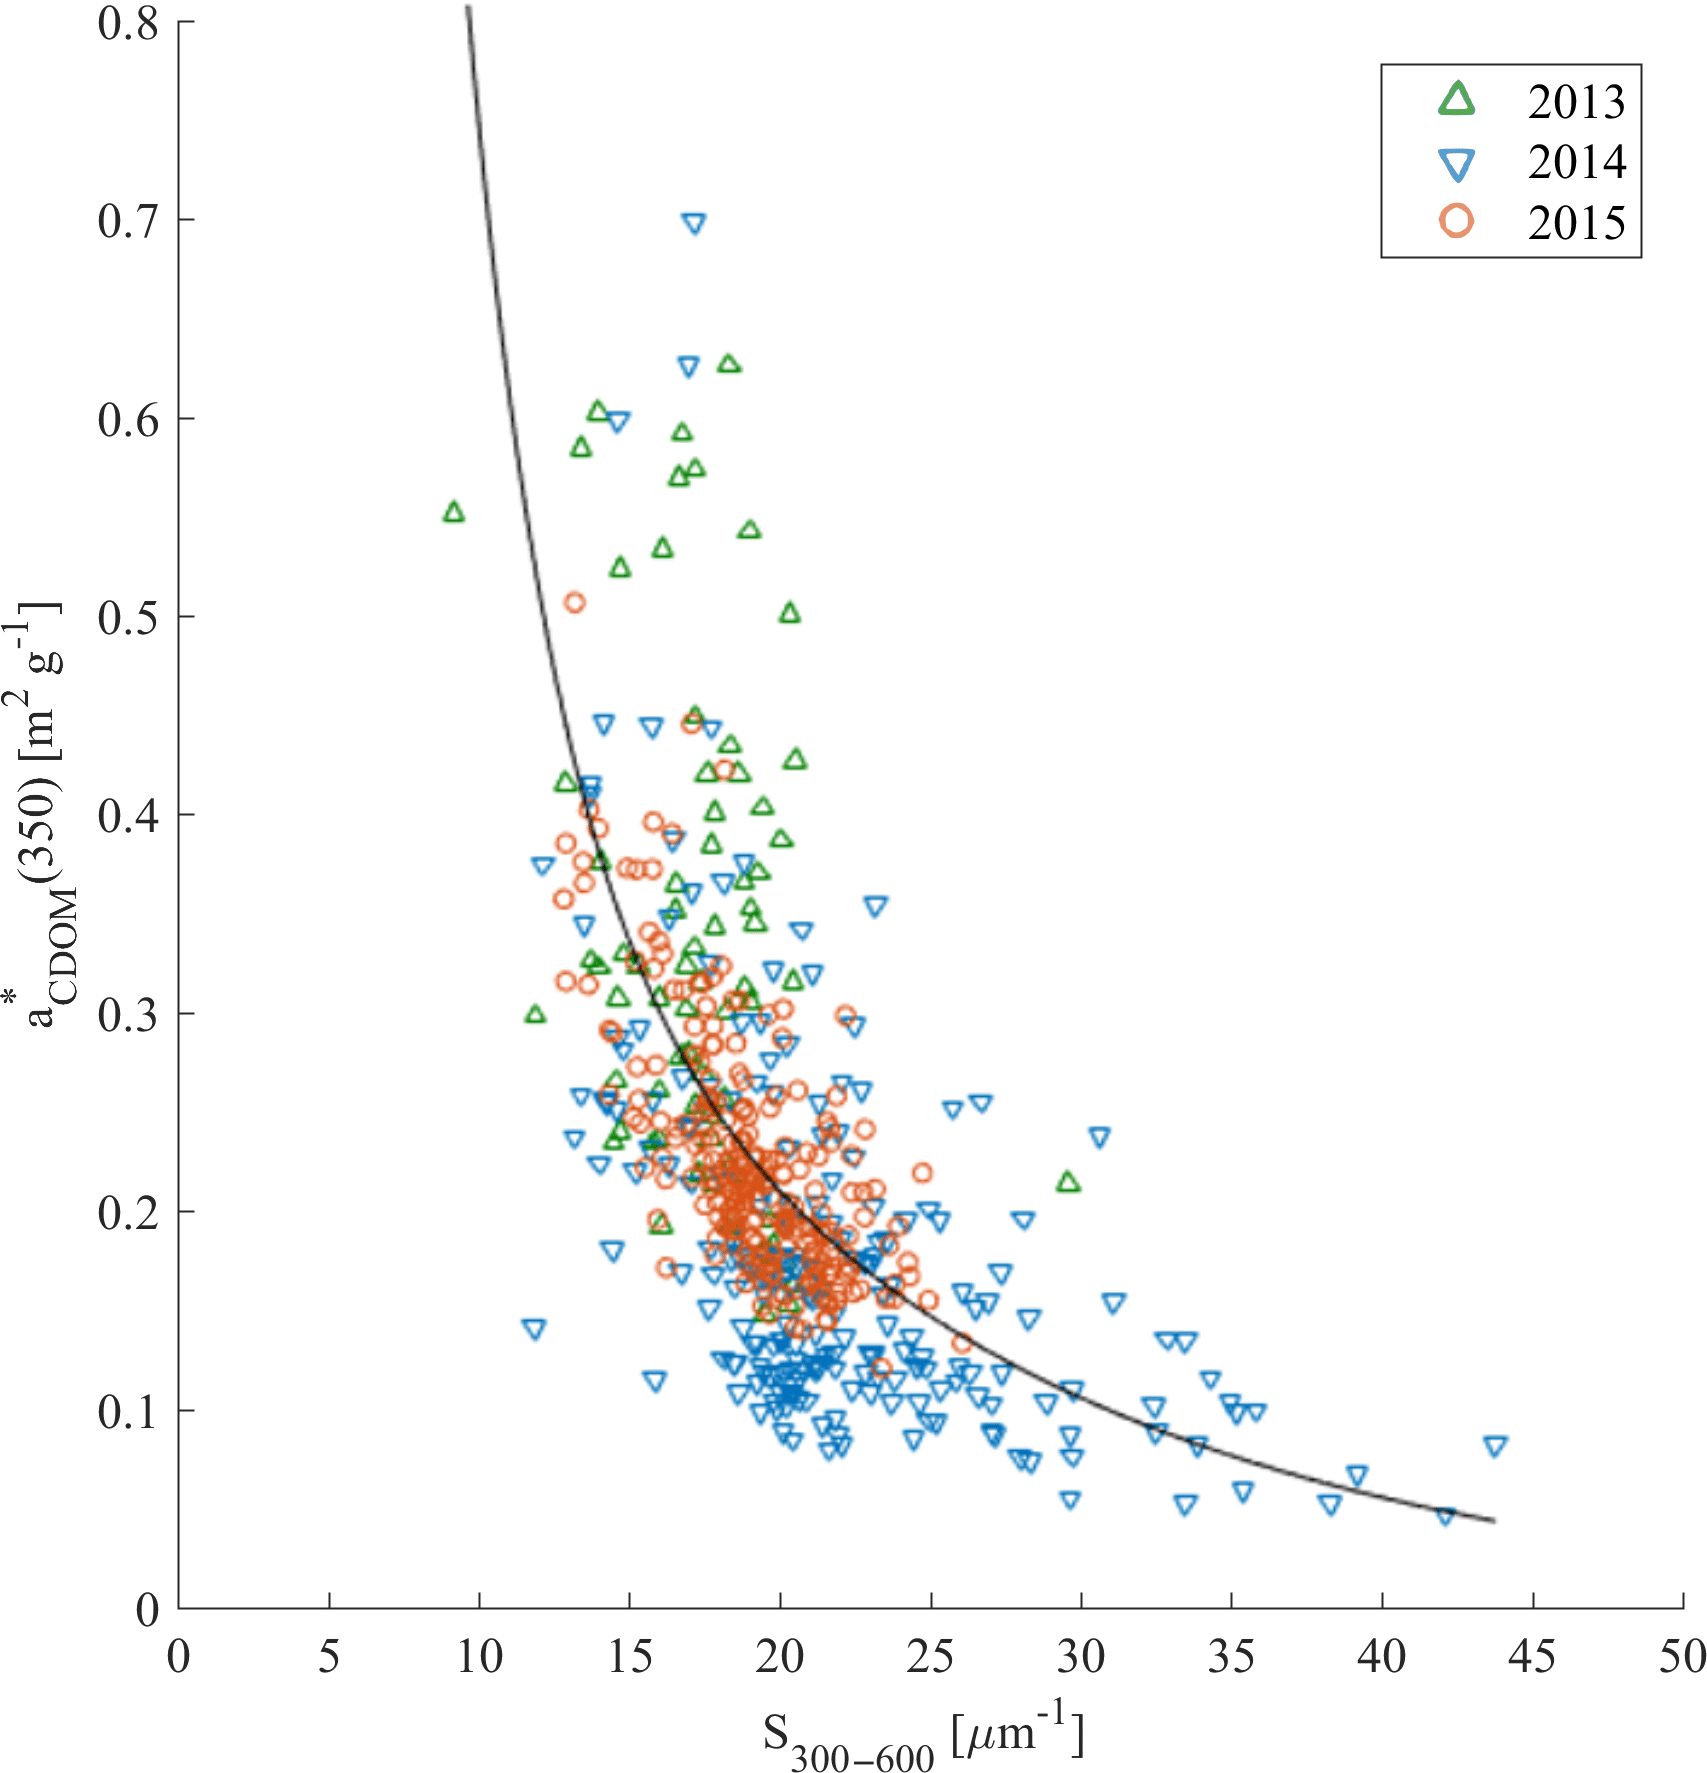
Figure 8(350) compared with S300–600 in samples from 2013 (green triangles), 2014 (blue reversed triangles), and 2015 (red circles). Nonlinear fitting function between those parameters was adopted from Fichot and Benner (2012): ; regression coefficients b1 = 0.0027, b2 = 73.31, b3 = 1.29, and b4 = −91.39 were estimated with the MATLAB curve fitting toolbox, with determination coefficient R2 = 0.38, n = 525.
4.4 Distribution of FDOM components in the ocean and their dependence on allochthonous and autochthonous sources
The distribution pattern of the main FDOM components with depth in the global oceans' biogeochemical provinces is significantly different for humic-like and protein-like FDOM (Stedmon and Nelson, 2015; Catalá et al., 2016). The intensity of the humic-like FDOM fraction is usually higher close to continental margins and significantly depleted in the centers of subtropical gyres (Murphy et al., 2008; Jørgensen et al., 2011; Kowalczuk et al., 2013). The fluorescence of humic-like DOM fractions is low in the surface layer and rapidly increases with depth, reaching a constant high level below 200 m. Protein-like FDOM fluorescence intensity usually increases toward the open ocean and the highest intensity is observed in the surface waters, rapidly decreasing with depth, reaching a constant low level below the epipelagic layer (Jørgensen et al., 2011; Kowalczuk et al., 2013; Catalá et al., 2016). Such profiles indicate that amino-acid-like DOM is linked to surface water production. Catalá et al. (2016) demonstrated that the global depth distribution tryptophan-like FDOM component has a local maximum associated with a chlorophyll a maximum. The linkage between protein-like components and chlorophyll a concentration shown qualitatively in the global ocean by Stedmon and Nelson (2015) and Catalá et al. (2016) was previously confirmed quantitatively in mesocosm studies, for example, Romera-Castillo et al. (2010), which indicated that phytoplankton excreted tryptophan-like fluorophores, and tryptophan-like component concentration has been related to primary production (Brym et al., 2014). In situ quantitative correlation between chlorophyll a concentrations and fluorescence intensity of the protein-like FDOM fraction has been observed and documented recently. Yamashita et al. (2017) reported significant positive correlation between the tryptophan-like component and Chla (r = 0.53, p < 0.001) in the surface waters of the Pacific Ocean. Yamashita et al. (2017) also found spatial coupling between the tryptophan-like component and chlorophyll a concentration, which was strongest in the Bering Sea. A study by Loginova et al. (2016) from a Peruvian upwelling system also reported a positively correlated chlorophyll a concentration and protein-like component (R2 = 0.40, p < 0.001).
The distribution of fluorescence intensity of the main FDOM components in the Nordic Seas, dominated by warm water of Atlantic origin, followed the general trends observed globally. The highest FDOM intensity, especially of humic-like components, was observed close to continental margins, in the vicinity of major river outflows. Para et al. (2013) observed significant inverse trends of humic-like FDOM components with salinity in the Canadian shelf of the Beaufort Sea close to McKenzie River outflow. Similar observations were documented by Gonçalves-Araujo et al. (2015) in the Lena River delta at the Siberian Shelf and by Pavlov et al. (2016) near the Northern Dvina River outlet in the White Sea. The impact of the humic-like FDOM component on DOM composition decreased with increased distance from freshwater sources and increased salinity, where the protein-like FDOM fraction became dominant, for example, outside of the McKenzie River plume in the Beaufort Sea (Para et al., 2013) and in the White Sea (Pavlov et al., 2016). In the Fram Strait the distribution of humic-like fluorescence (ex. = 340 nm and em. = 420 nm) observed by Amon et al. (2003) in the Fram and Denmark straits was related to large-scale water mass distribution in the Nordic Seas and was characterized by elevated values of FDOM intensity in the western part of Fram Strait that was under the influence of the EGC, and characterized by low FDOM intensity and FDOM intensity uniformly distributed with depth in the core of AW in its eastern part. The FDOM distribution in AW shown by Amon et al. (2003) corresponded well to vertical profiles of ICH1 and ICH2 in AW, shown in Fig. 4. This was also in good agreement with CDOM distribution in the Fram Strait (Granskog et al., 2012; Pavlov et al., 2015) and FDOM humic-like fraction (ex. = 280 nm and em. = 450 nm) distribution presented by Granskog et al. (2015b). The humic-like fraction of DOM in the eastern Fram Strait is more than 10 times lower compared to PW in the EGC (Granskog et al., 2015b). A 20 m layer of less saline water diluted by sea ice melt characterized by significantly lower humic-like FDOM intensity overlaid the PW water with high FDOM intensity in the EGC (Granskog et al., 2015b).
In situ fluorometry provided an opportunity to study FDOM distribution in greater detail and commercially available FDOM fluorometers are usually built to detect humic substances (Amon et al., 2003; Belzile et al., 2006; Kowalczuk et al., 2010; Aiken et al., 2011; Loginova et al., 2016). In this study we simultaneously measured three different FDOM components, and the most interesting feature observed with the use of this new instrument was very significant spatial coupling between ICH3 and IFChla. Similarities in the vertical distribution of protein-like FDOM, ICH3, stimulated chlorophyll a fluorescence intensity, IFChla, and total non-water absorption coefficient at 676 nm, atot−w(676), implied quantitative interrelation among those parameters and the same dominant factor controlling these parameters in time and space. We found a significant positive correlation (R2 = 0.65, p < 0.0001) between ICH3 and IFChla (Fig. 5a), which suggests that production of protein-like FDOM is closely related to spatial and temporal phytoplankton dynamics. Additionally, a statistically significant dependence of and Chla concentration from water samples indicated that phytoplankton biomass is an important source of protein-like FDOM.
We observed significant interannual variation in CDOM optical properties in the Nordic Seas. It is likely that these year-to-year changes in CDOM absorption coefficient and spectral slope coefficient were related to the intensity of AW inflow to the Nordic Seas. According to Walczowski et al. (2017) there was very strong interannual variability in AW inflow overlaid on the long-term increasing trend. CDOM absorption decreased and spectral slope coefficient increased during years when an increase in temperature was observed for AW (Walczowski et al., 2017), e.g., in 2009 (Pavlov et al., 2015) and in 2014 (this study). Decrease in AW temperature was accompanied by mutual increase in aCDOM(350) and decrease in S300–600, e.g., in 2010 (Pavlov et al., 2015) and in 2013 and 2015 (this study). We surmise that during less intense inflow of AW to the Nordic Seas a higher proportion of PW is transported with the ESC and SC to the eastern part of Fram Strait, contributing to the increase in CDOM in West Spitsbergen Shelf waters.
In situ observations with the use of a three-channel fluorometer coupled with other optical instruments enabled us to show a significant correlation between protein-like FDOM and chlorophyll a in the Nordic Seas. Quantitative dependence between protein-like FDOM () and chlorophyll a fluorescence (IFChla) and between protein-like FDOM (ICH3) and total non-water absorption coefficient at 676 nm (atot−w(676)) based on direct in situ observations clearly indicated that phytoplankton biomass is the primary source of low-molecular-weight DOM fraction in Nordic Seas influenced by warm AW. This highlights the role of phytoplankton dynamics as an important factor controlling FDOM/CDOM. The freshly produced protein-like FDOM fraction did not contribute to CDOM/FDOM optical properties observed in the visible spectral range as its fluorescence excitation (absorption) and emission characteristics were located in the ultraviolet spectral range. Observed variability in spectral index ((350), SUVA254, S300–600) values suggest that CDOM/FDOM in the Nordic Seas has an autochthonous origin. Yet, further investigation of the DOM transformation processes from labile freshly produced protein-like DOM fractions to more complex organic molecules is needed to better understand the CDOM/FDOM dynamics in the Nordic Seas. Typically humic-like FDOM was found in low concentrations in the study area, showcasing the limited terrestrial influence, in contrast to the East Greenland Current, for example (Gonçalves-Araujo et al., 2016).
Dissolved organic carbon (DOC) was weakly correlated with aCDOM(350) in the study area, likely due to limited terrestrial influence, and aCDOM(350) shows no promise to be used as a tool to predict DOC. The same was the case for spectral slope at short wavelengths (S275–295), proven earlier to work for nearshore environs (Fichot and Benner, 2011, 2012). Conversely, there was a significant inverse nonlinear relationship of CDOM-specific DOC absorption ((350)) with spectral slope at a broader spectral range (S300–600). This relationship provides a potential for indirect estimates of DOC with the use of optical measurements in this region.
All data used in this study will be freely available, for scientific use only, upon request. Anyone interested in using this data set for scientific research should contact the corresponding author via e-mail.
The supplement related to this article is available online at: https://doi.org/10.5194/os-14-543-2018-supplement.
The authors declare that they have no conflict of interest.
We thank the crew of R/V Oceania and colleagues for the help
onboard. This work was supported by the Polish–Norwegian Research Programme
operated by the National Centre for Research and Development under the
Norwegian Financial Mechanism 2009–2014 in the frame of project contract
Pol–Nor/197511/40/2013, CDOM–HEAT. This work was partially financed from
the funds of the Leading National Research Centre (KNOW) received by the
Centre for Polar Studies for the period 2014–2018. Mats A. Granskog was
supported by the Centre for Ice, Climate and Ecosystems (ICE) at the
Norwegian Polar Institute, and Alexey K. Pavlov by the Research Council of
Norway through the STASIS project
(221961/F20).
Edited by: Oliver
Zielinski
Reviewed by: two anonymous referees
Aas, E. and Høkedal, J.: Penetration of ultraviolet B, blue and quanta irradiance into Svalbard waters, Polar Res., 15, 127–138, https://doi.org/10.1111/j.1751-8369.1996.tb00464.x, 1996.
Aiken, C. R. M., Petersen, W., Schroeder, F., Gehrung, M., and Ramirez von Holle, P. A.: Ship-of-Opportunity Monitoring of the Chilean Fjords Using the Pocket FerryBox, J. Atmos. Ocean. Tech., 28, 1338–1350, 2011.
Amon, R. M. W.: The Role of Dissolved Organic Matter for the Organic Carbon Cycle. The Arctic Ocean, in: The organic carbon cycle in the Arctic Ocean, edited by: Stein, R. and Macdonald, R. W., chap. 4, 82–99, Springer, Berlin, Heidelberg, 2004.
Amon, R. M. W., Budéus, G., and Meon, B.: Dissolved organic carbon distribution and origin in the Nordic Seas: Exchanges with the Arctic Ocean and the North Atlantic, J. Geophys. Res., 108, 3221, https://doi.org/10.1029/2002JC001594, 2003.
Amon, R. M. W., Rinehart, A. J., Duan, S., Louchouarn, P., Prokushkin, A., Guggenberger, G., Bauch, D., Stedmon, C. A., Raymond, P. A., Holmes, R. M., McClelland, J. W., Peterson, B. J., Walker, S. A., and Zhulidov, A. V.: Dissolved organic matter sources in large Arctic rivers, Geochim. Cosmochim. Ac., 94, 217–237, https://doi.org/10.1016/j.gca.2012.07.015, 2012.
Anderson, L. G. and Amon, R. M. W.: DOM in the Arctic Ocean, in: Biogeochemistry of Marine Dissolved Organic Matter, edited by: Hansell, D. A. and Carlson, C. A., 609–633, Academic Press, Amsterdam, Boston, 2015.
Arrigo, K. and Brown, C.: Impact of chromophoric dissolved organic matter on UV inhibition of primary productivity in the sea, Mar. Ecol.-Prog. Ser., 140, 207–2016, 1996.
Arrigo, K. R., van Dijken, G., and Pabi, S.: Impact of a shrinking Arctic ice cover on marine primary production, Geophys. Res. Lett., 35, L19603, https://doi.org/10.1029/2008GL035028, 2008.
Belzile, C., Roesler, C. S., Christensen, J. P., Shakhova, N., and Semiletov, I.: Fluorescence measured using the WETStar DOM fluorometer as a proxy for dissolved matter absorption, Estuar. Coast. Shelf S., 67, 441–449, 2006.
Bélanger, S., Cizmeli, S. A., Ehn, J., Matsuoka, A., Doxaran, D., Hooker, S., and Babin, M.: Light absorption and partitioning in Arctic Ocean surface waters: impact of multiyear ice melting, Biogeosciences, 10, 6433–6452, https://doi.org/10.5194/bg-10-6433-2013, 2013.
Brym, A., Paerl, H. W., Montgomery, M. T., Handsel, L. T., Ziervogel, K., and Osburn, C. L.: Optical and chemical characterization of base-extracted particulate organic matter in coastal marine environments, Mar. Chem., 162, 96–113, https://doi.org/10.1016/j.marchem.2014.03.006, 2014.
Catalá, T. S., Álvarez-Salgado, X. A., Otero, J., Iuculano, F., Companys, B., Horstkotte, B., Romera-Castillo, C., Nieto-Cid, M., Latasa, M., Morán, X. A. G., Gasol, J. M., Marrasé, C., Stedmon, C. A., and Reche, I.: Drivers of fluorescent dissolved organic matter in the global epipelagic ocean, Limnol. Oceanogr., 61, 1101–1119, https://doi.org/10.1002/lno.10281, 2016.
Coble, P. G.: Characterization of marine and terrestrial DOM in seawater using excitation–emission matrix spectroscopy, Mar. Chem., 51, 325–346, 1996.
Coble, P. G.: Marine optical biogeochemistry: The chemistry of ocean color, Chem. Rev., 107, 402–418, https://doi.org/10.1021/cr050350+, 2007.
Dalpadado, P., Arrigo, K. R., Hjøllo, S. S., Rey, F., Ingvaldsen, R. B., Sperfeld, E., van Dijken, G. L., Stige, L. C., Olsen, A., and Ottersen, G.: Productivity in the Barents Sea-response to recent climate variability, PloS one, 9, e95273, https://doi.org/10.1371/journal.pone.0095273, 2014.
Erickson III, D. J., Sulzberger, B., Zepp, R. G., and Austin, A. T.: Effects of stratospheric ozone depletion, solar UV radiation, and climate change on biogeochemical cycling: interactions and feedbacks, Photochemical and Photobiological Sciences, 14, 127–148, 2015.
Fichot, C. G. and Benner, R.: A novel method to estimate DOC concentrations from CDOM absorption coefficients in coastal waters, Geophys. Res. Lett., 38, L03610, https://doi.org/10.1029/2010GL046152, 2011.
Fichot C. G. and Benner, R.: The spectral slope coefficient of chromophoric dissolved organic matter (S275–295) as a tracer of terrigenous dissolved organic carbon in river-influenced ocean margins, Limnol. Oceanogr., 57, 1453–1466, https://doi.org/10.4319/lo.2012.57.5.1453, 2012.
Fichot, C. G., Kaiser, K., Hooker, S. B., Amon, R. M. W., Babi, M., Bélanger, S., Walker, S. A., and Benner, R.: Pan-Arctic distributions of continental runoff in the Arctic Ocean, Scientific Reports, 3, 1053, https://doi.org/10.1038/srep01053, 2013.
Findlay, H. S., Gibson, G., Kędra, M., Morata, N., Orchowska, M., Pavlov, A. K., Reigstad, M., Silyakova, A., Tremblay, J. É., Walczowski, W., and Weydmann, A.: Responses in Arctic marine carbon cycle processes: conceptual scenarios and implications for ecosystem function, Polar Res., 34, 24252, https://doi.org/10.3402/polar.v34.24252, 2015.
Gonçalves-Araujo, R., Stedmon, C. A., Heim, B., Dubinenkov, I., Kraberg, A., Moiseev, D., and Bracher, A.: From Fresh to Marine Waters: Characterization and Fate of Dissolved Organic Matter in the Lena River Delta Region, Siberia, Front. Mar. Sci., 2, 108, https://doi.org/10.3389/fmars.2015.00108, 2015.
Gonçalves-Araujo, R., Granskog, M. A., Bracher, A., Azetsu-Scott, K., Dodd, P. A., and Stedmon, C. A.: Using fluorescent dissolved organic matter to trace and distinguish the origin of Arctic surface waters, Scientific Reports, 6, 1–12, https://doi.org/10.1038/srep33978, 2016.
Gonçalves-Araujo, R., Rabe, B., Peeken, I., and Bracher, A.: High colored dissolved organic matter (CDOM) absorption in surface waters of the central-eastern Arctic Ocean: Implications for biogeochemistry and ocean color algorithms, PLoS One, 13, e0190838, https://doi.org/10.1371/journal.pone.0190838, 2018.
Granskog, M. A., Macdonald, R. W., Mundy, C. J., and Barber, D. G.: Distribution, characteristics and potential impacts of chromophoric dissolved organic matter (CDOM) in the Hudson Strait and the Hudson Bay, Canada, Cont. Shelf Res., 27, 2032–2050, https://doi.org/10.1016/j.csr.2007.05.001, 2007.
Granskog, M. A., Stedmon, C. A., Dodd, P. A., Amon, R. M., Pavlov, A. K., Steur, L., and Hansen, E.: Characteristics of colored dissolved organic matter (CDOM) in the Arctic outflow in the Fram Strait: Assessing the changes and fate of terrigenous CDOM in the Arctic Ocean, J. Geophys. Res., 117, C12021, https://doi.org/10.1029/2012JC008075, 2012.
Granskog, M. A., Nomura, D., Müller, S., Krell, A., Toyota, T., and Hattori, H.: Evidence for significant protein-like dissolved organic matter accumulation in Sea of Okhotsk sea ice, Ann. Glaciol., 56, 1–8, https://doi.org/10.3189/2015AoG69A002, 2015a.
Granskog, M. A., Pavlov, A. K.,Sagan, S., Kowalczuk, P., Raczkowska, A., and Stedmon, C. A.: Effect of sea-ice melt on inherent optical properties and vertical distribution of solar radiant heating in Arctic surface waters, J. Geophys. Res.-Oceans, 120, 7028–7039, https://doi.org/10.1002/2015JC011087, 2015b.
Hancke, K., Hovland, E. K., Volent, Z., Pettersen, R., Johnsen, G., Moline, M., and Sakshaug, E.: Optical properties of CDOM across the Polar Front in the Barents Sea: Origin, distribution and significance, J. Marine Syst., 130, 219–227, 2014.
Harvey, G. R., Boran, D. A., Chesal, L. A., and Tokar, J. M.: The structure of marine fulvic and humic acids, Mar. Chem., 12, 119–132, 1983.
Hill, V.: Impacts of chromophoric dissolved organic material on surface ocean heating in the Chukchi Sea, J. Geophys. Res.-Oceans, 113, C07024, https://doi.org/10.1029/2007JC004119, 2008.
Jørgensen, L., Stedmon, C. A., Kragh, T., Markager, S., Middelboe, M., and Søndergaard, M.: Global trends in the fluorescence characteristics and distribution of marine dissolved organic matter, Mar. Chem., 126, 139–148, 2011.
Jørgensen, L., Stedmon, C. A., Granskog, M. A., and Middelboe, M.: Tracing the long-term microbial production of recalcitrant fluorescent dissolved organic matter in seawater, Geophys. Res. Lett., 41, 2481–2488, 2014.
Kitidis, V., Stubbins, A. P., Uher, G., Goddard, R. C. U., Law, C. S., and Woodward, E. M. S.: Variability of chromophoric organic matter in surface waters of the Atlantic Ocean, Deep-Sea Res. Pt. II, 53, 1666–1684, 2006.
Kieber, D. J., Peake, B. M., and Scully, N. M.: Reactive oxygen species in aquatic ecosystems, in: UV Effects in Aquatic Organisms, edited by: Helbling, E. W. and Zagarese, H., Royal Society of Chemistry, Cambridge, 251–288, 2003.
Kowalczuk, P., Stedmon, C. A., and Markager, S.: Modelling absorption by CDOM in the Baltic Sea from season, salinity and chlorophyll, Mar. Chem., 101, 1–11, 2006.
Kowalczuk, P., Zabłocka, M., Sagan, S., and Kuliński, K.: Fluorescence measured in situ as a proxy of CDOM absorption and DOC concentration in the Baltic Sea, Oceanologia, 52, 431–471, 2010.
Kowalczuk, P., Tilstone, G. H., Zabłocka, M., Röttgers, R., and Thomas, R.: Composition of Dissolved Organic Matter along an Atlantic Meridional Transect from fluorescence spectroscopy and Parallel Factor Analysis, Mar. Chem., 157, 170–184, 2013.
Kowalczuk, P., Meler, J., Kauko, H., Pavlov, A. K., Zabłocka, M., Peeken, I., Dybwad, C., Castellani, G., and Granskog, M. A.: Bio-optical properties of Arctic drift ice and surface waters north of Svalbard from winter to spring, J. Geophys. Res.-Oceans, 122, 4634–466, 2017.
Loeng, H.: Features of the physical oceanographic conditions of the Barents Sea, Polar Res., 10, 5–18, 1991.
Loginova, A. N., Thomsen, S., and Engel, A.: Chromophoric and fluorescent dissolved organic matter in and above the oxygen minimum zone off Peru, J. Geophys. Res.-Oceans, 121, 7973–7990, https://doi.org/10.1002/2016JC011906, 2016.
Lund-Hansen, L. C., Markager, S., Hancke, K., Stratmann, T., Rysgaard, S., Ramløv, H., and Sorrell, B. K.: Effects of sea-ice light attenuation and CDOM absorption in the water below the Eurasian sector of central Arctic Ocean (> 88∘ N), Polar Res., 34, 23978, https://doi.org/10.3402/polar.v34.23978, 2015.
Mann, P. J., Spencer, R. G. M., Hernes, P. J., Six, J., Aiken, G. R., Tank, S. E., McClelland, J. W., Butler, K. D., Dyda, R. Y., and Holmes, R. M.: Pan-Arctic Trends in Terrestrial Dissolved Organic Matter from Optical Measurements, Front. Earth Sci., 4, 25, https://doi.org/10.3389/feart.2016.00025, 2016.
Matsuoka, A., Hill, V., Huot, Y., Babin, M., and Bricaud, A.: Seasonal variability in the light absorption properties of western Arctic waters: Parameterization of the individual components of absorption for ocean color applications, J. Geophys. Res.-Oceans, 116, C02007, https://doi.org/10.1029/2009JC005594, 2011.
Matsuoka, A., Bricaud, A., Benner, R., Para, J., Sempéré, R., Prieur, L., Bélanger, S., and Babin, M.: Tracing the transport of colored dissolved organic matter in water masses of the Southern Beaufort Sea: relationship with hydrographic characteristics, Biogeosciences, 9, 925–940, https://doi.org/10.5194/bg-9-925-2012, 2012.
Matsuoka, A., Hooker, S. B., Bricaud, A., Gentili, B., and Babin, M.: Estimating absorption coefficients of colored dissolved organic matter (CDOM) using a semi-analytical algorithm for southern Beaufort Sea waters: application to deriving concentrations of dissolved organic carbon from space, Biogeosciences, 10, 917–927, https://doi.org/10.5194/bg-10-917-2013, 2013.
Matsuoka, A., Boss, E., Babin, M., Karp-Boss, L., Hafezd, M., Chekalyuk, A., Proctore, C. W., Werdell, P. J., and Bricaud, A.: Pan-Arctic optical characteristics of colored dissolved organic matter: Tracing dissolved organic carbon in changing Arctic waters using satellite ocean color data, Remote Sens. Environ., 200, 89–101, 2017.
Massicotte, P., Asmala, E., Stedmon C. A., and Markager, S.: Global distribution of dissolved organic matter along the aquatic continuum: Across rivers, lakes and oceans, Sci. Total Environ., 609, 180–191, https://doi.org/10.1016/j.scitotenv.2017.07.076, 2017.
Meier, W. M., Hovelsrud, G. K., van Oort, B. E. H., Key, J. R., Kovacs, K. M., Michel, C., Haas, C., Granskog, M. A., Gerland, S., Perovich, D. K., Makshtas, A., and Reist, J. D.: Arctic sea ice in transformation: A review of recent observed changes and impacts on biology and human activity, Rev. Geophys., 52, 185–217, https://doi.org/10.1002/2013RG000431, 2014.
Meler, J., Kowalczuk, P., Ostrowska, M., Ficek, D., Zablocka, M., and Zdun, A.: Parameterization of the light absorption properties of chromophoric dissolved organic matter in the Baltic Sea and Pomeranian lakes, Ocean Sci., 12, 1013–1032, https://doi.org/10.5194/os-12-1013-2016, 2016.
Mopper, K. and Kieber, D. J.: Photochemistry and the cycling of carbon, sulfur, nitrogen and phosphorus, in: Biogeochemistry of Marine Dissolved Organic Matter, editd by: Hansell, D. A. and Carlson, C. A., Academic Press, New York, 455–507, 2002.
Murphy, K. R., Stedmon, C. A., Waite, T. D., and Ruiz, G. M.: Distinguishing between terrestrial and autochthonous organic matter sources in marine environments using fluorescence spectroscopy, Mar. Chem., 108, 40–58, 2008.
Murphy, K. R., Stedmon, C. A., Graeber, D., and Bro, R.: Fluorescence spectroscopy and multi-way techniques, PARAFAC, Anal. Methods-UK, 5, 6557, https://doi.org/10.1039/c3ay41160e, 2013.
Murphy, K. R., Stedmon, C. A., Wenig, P., and Bro, R.: OpenFluor – an online spectral library of auto-fluorescence by organic compounds in the environment, Anal. Methods-UK, 6, 658–661, https://doi.org/10.1039/C3AY41935E, 2014.
Nelson, N. B. and Siegel, D. A.: The Global Distribution and Dynamics of Chromophoric Dissolved Organic Matter, Annu. Rev. Mar. Sci., 5, 447–476, https://doi.org/10.1146/annurev-marine-120710-100751, 2013.
Nilsen, F., Skogseth, R., Vaardal-Lunde, J., and Inall, M.: A Simple Shelf Circulation Model: Intrusion of Atlantic Water on the West Spitsbergen Shelf, J. Phys. Oceanogr., 46, 1209–1230, https://doi.org/10.1175/JPO-D-15-0058.1, 2015.
Nima, C., Frette, Ø., Hamre, B., Erga, S. R., Chen, Y.-C., Zhao, L., Sørensen, K., Norli, M., Stamnes, K., and Stamnes, J. J.: Absorption properties of high-latitude Norwegian coastal water: the impact of CDOM and particulate matter, Estuar. Coast. Shelf S., 178, 158–167, https://doi.org/10.1016/j.ecss.2016.05.012, 2016.
Obernosterer, I. and Benner, R.: Competition between biological and photochemical processes in the mineralization of dissolved organic carbon, Limnol. Oceanogr., 49, 117–124, 2004.
Olsen, E., Aanes, S., Mehl, S., Holst, J. C., Aglen, A., and Gjøsæter, H.: Cod, haddock, saithe, herring, and capelin in the Barents Sea and adjacent waters: a review of the biological value of the area, ICES J. Mar. Sci., 67, 87–101, 2009.
Osburn, C. L., Retamal, L., and Vincent, W. F.: Photoreactivity of chromophoric dissolved organic matter transported by the Mackenzie River to the Beaufort Sea, Mar. Chem., 115, 10–20, 2009.
Para, J., Charrière, B., Matsuoka, A., Miller, W. L., Rontani, J. F., and Sempéré, R.: UV/PAR radiation and DOM properties in surface coastal waters of the Canadian shelf of the Beaufort Sea during summer 2009, Biogeosciences, 10, 2761–2774, https://doi.org/10.5194/bg-10-2761-2013, 2013.
Pavlov, A. K., Silyakova, A., Granskog, M. A., Bellerby, R. G., Engel, A., Schulz, K. G., and Brussaard, C. P.: Marine CDOM accumulation during a coastal Arctic mesocosm experiment: No response to elevated pCO2 levels, J. Geophys. Res.-Biogeo., 119, 1216–1230, https://doi.org/10.1002/2013JG002587, 2014.
Pavlov, A. K., Granskog, M. A., Stedmon, C. A., Ivanov, B. V., Hudson, S. R., and Falk-Petersen, S.: Contrasting optical properties of surface waters across the Fram Strait and its potential biological implications, J. Marine Syst., 143, 62–72, https://doi.org/10.1016/j.jmarsys.2014.11.001, 2015.
Pavlov, A. K., Stedmon, C. A., Semushin, A. V., Martma, T., Ivanov, B. V., Kowalczuk, P., and Granskog, M. A.: Linkages between the circulation and distribution of dissolved organic matter in the White Sea, Arctic Ocean, Cont. Shelf Res., 119, 1–13, https://doi.org/10.1016/j.csr.2016.03.004, 2016.
Pavlov, A. K., Taskjelle, T., Kauko, H. M., Hamre, B., Hudson, S. R., Assmy, P., Duarte, P., Fernández-Méndez, M., Mundy, C. J., and Granskog, M. A.: Altered inherent optical properties and estimates of the underwater light field during an Arctic under ice bloom of Phaeocystis pouchetii, J. Geophys. R.-Oceans, 122, 4939–4961, https://doi.org/10.1002/2016JC012471, 2017.
Pegau, W. S.: Inherent optical properties of the central Arctic surface waters, J. Geophys. Res., 107, 8035, https://doi.org/10.1029/2000JC000382, 2002.
Polyakov, I. V., Pnyushkov, A. V., Alkire, M. B., Ashik, I. M., Baumann, T. M., Carmack, E. C., Goszczko, I., Guthrie, J., Ivanov, V. V., Kanzow, T., and Krishfield, R.: Greater role for Atlantic inflows on sea-ice loss in the Eurasian Basin of the Arctic Ocean, Science, 356, 285–291, 2017.
Prowse, T., Bring, A., Mård, J., Carmack, E., Holland, M., Instanes, A., Vihma, T., and Wrona, F. J.: Arctic Freshwater Synthesis: Summary of key emerging issues, J. Geophys. Res.-Biogeo., 120, 1887–1893, https://doi.org/10.1002/2015JG003128, 2015.
Retelletti-Brogi, S., Ha, S.-Y., Kim, K., Derrien, M., Lee, Y. K., and Hur, J.: Optical and molecular characterization of dissolved organic matter (DOM) in the Arctic ice core and the underlying seawater (Cambridge Bay, Canada): Implication for increased autochthonous DOM during ice melting, Sci. Total Environ., 627, 802–811, 2018.
Romera-Castillo, C., Sarmento, H., Álvarez-Salgado, X. A., Gasol, J. M., and Marrasé, C.: Production of chromophoric dissolved organic matter by marine phytoplankton, Limnol. Oceanogr., 55, 446–454, 2010.
Rudels, B., Friedrich, H. J., and Quadfasel, D.: The arctic circumpolar boundary current, Deep-Sea Res. Pt. II, 46, 1023–1062, 1999.
Rudels, B., Fahrbach, E., Meincke, J., Budéus, G., and Eriksson, P.: The East Greenland Current and its contribution to the Denmark Strait Overflow, ICES J. Mar. Sci., 59, 1133–1154, 2002.
Rudels, B., Björk, G., Nilsson, J., Winsor, P., Lake, I., and Nohr, C.: The interaction between waters from the Arctic Ocean and the Nordic Seas north of Fram Strait and along the East Greenland Current: results from the Arctic Ocean–02 Oden expedition, J. Marine Syst., 55, 1–30, https://doi.org/10.1016/j.jmarsys.2004.06.008, 2005.
Schlichtholz, P. and Houssais, M.-N.: An investigation of the dynamics of the East Greenland Current in Fram Strait based on a simple analytical model, J. Phys. Oceanogr., 29, 2240–2265, 1999a.
Schlichtholz, P. and Houssais, M.-N.: An inverse modeling study in Fram Strait. Part II: Water mass distribution and transports, Deep-Sea Res. Pt. II, 46, 11367–1168, 1999b.
Schlichtholz, P. and Houssais, M.-N.: An overview of the q-S correlations in Fram Strait based n the MIZEX 84 data, Oceanologia, 44, 243–272, 2002.
Schlitzer, R.: Ocean Data View, available at: http://odv.awi.de (last access: 6 May 2018), 2016.
Sharp, J. H.: Analytical methods for total DOM pools, in: Biogeochemistry of marine dissolved organic matter, edited by: Hansell, D. A. and Carlson, C. A., 35–58, Biogeochemistry of marine dissolved organic matter, Academic Press, San Diego, XXII, 774, 2002.
Skogen, M. D., Budgell, W. P., and Rey, F.: Interannual variability in Nordic seas primary production, ICES J. Mar. Sci., 64, 889–898, 2007.
Spencer, R. G. M., Butler, K. D., and Aiken, G. R.: Dissolved organic carbon and chromophoric dissolved organic matter properties of rivers in the USA, J. Geophys. Res., 117, G03001, https://doi.org/10.1029/2011JG001928, 2012.
Spencer, R. G. M., Mann, P. J., Dittmar, T., Eglinton, T. I., McIntyre, C., Holmes, R. M., Zimov, N., and Stubbins, A.: Detecting the signature of permafrost thaw in Arctic rivers. Geophys. Res. Lett., 42, 2830–2835, https://doi.org/10.1002/2015GL063498, 2015.
Stedmon, C. and Markager, S.: The optics of chromophoric dissolved organic matter (CDOM) in the Greenland Sea: An algorithm for differentiation between marine and terrestrially derived organic matter, Limnol. Oceanogr., 46, 2087–2092, 2001.
Stedmon, C. A. and Nelson, N. B.: The Optical Properties of DOM in the Ocean, in: Biogeochemistry of Marine Dissolved Organic Matter, edited by: Hansell, D. A. and Carlson, C. A., 480–508, Academic Press, Amsterdam, Boston, 2015.
Stedmon, C. A., Markager, S., and Kaas, H.: Optical properties and signatures of chromophoric dissolved organic matter (CDOM) in Danish coastal waters, Estuar. Coast. Shelf S., 51, 267–278, 2000.
Stedmon C. A., Markager S., and Bro, R.: Tracing dissolved organic matter in aquatic environments using a new approach to fluorescence spectroscopy, Mar. Chem., 82, 239–254, https://doi.org/10.1016/S0304-4203(03)00072-0, 2003.
Stedmon, C. A., Amon, R. M. W., Rinehart, A. J., and Walker, S. A.: The supply and characteristics of colored dissolved organic matter (CDOM) in the Arctic Ocean: Pan Arctic trends and differences, Mar. Chem., 124, 108–118, 2011.
Stedmon, C. A., Granskog, M. A., and Dodd, P. A.: An approach to estimate the freshwater contribution from glacial melt and precipitation in East Greenland shelf waters using colored dissolved organic matter (CDOM), J. Geophys. Res.-Oceans, 120, 1107–1117, https://doi.org/10.1002/2014JC010501, 2015.
Stein, R. and Macdonald, R. W.: Organic carbon budget: Arctic Ocean vs. global ocean, in: The organic carbon cycle in the Arctic Ocean, 315–322, Springer, Berlin Heidelberg, 2004.
Sternal, B., Szczucinski, W., Forwick, M., Zajączkowski, M., Lorenc, S., and Przytarska, J.: Postglacial variability in near-bottom current speed on the Continental shelf off south-west Spitsbergen, J. Quaternary Sci., 29, 767–777, 2014.
Stramska, M., Stramski, D., Hapter, R., Kaczmarek, S., and Stoń, J.: Bio-optical relationships and ocean color algorithms for the north polar region of the Atlantic, J. Geophys. Res., 108, 3143, https://doi.org/10.1029/2001JC001195, 2003.
Strickland, J. D. H. and Parsons, T. R.: A practical handbook of seawater analysis, 2nd Edn., Bulletin 167, Fisheries Research Board of Canada, Ottawa, 1972.
Swift, J. H. and Aagaard, K.: Seasonal transitions and water mass formation in the Iceland and Greenland seas, Deep-Sea Res. Pt. A, 28, 1107–1129, 1981.
Walczowski, W.: Atlantic Water in the Nordic Seas, Springer, Heidelberg, New York, London, 174 pp., 2014.
Walczowski, W., Beszczynska-Möller, A., Wieczorek, P., Merchel, M., and Grynczel, A.: Oceanographic observations in the Nordic Sea and Fram Strait in 2016 under the IOPAN long-term monitoring program AREX, Oceanologia, 59, 187–194, https://doi.org/10.1016/j.oceano.2016.12.003, 2017.
Walker, S. A., Amon, R. M. W., and Stedmon, C. A.: Variations in high-latitude riverine fluorescent dissolved organic matter: A comparison of large Arctic rivers, J. Geophys. Res.-Biogeo., 118, 1689–1702, https://doi.org/10.1002/2013JG002320, 2013.
Weishaar, J. L., Aiken, G. R., Bergamaschi, B. A., Fram, M. S., Fujii, R., and Mopper, K.: Evaluation of specific ultraviolet absorbance as an indicator of the chemical composition and reactivity of dissolved organic matter, Environ. Sci. Technol., 37, 4702–4708, 2003.
Whitehead, K. and Vernet, M.: Influence of mycosporine-like amino acids (MAAs) on UV absorption by particulate and dissolved organic matter in La Jolla Bay, Limnol. Oceanogr., 45, 1788–1796, 2000.
Yamashita, Y., Hashihama, F., Saito, H., Fukuda, H., and Ogawa, H.: Factors controlling the geographical distribution of fluorescent dissolved organic matter in the surface waters of the Pacific Ocean, Limnol. Oceanogr., 62, 2360–2374, https://doi.org/10.1002/lno.10570, 2017.
Zaneveld, J. R. V., Kitchen, J. C., and Moore, C.: The scattering error correction of reflecting-tube absorption meters, Proc. SPIE Soc. Opt. Eng., 2258, 44–55, 1994.
Zepp, R. G.: Solar ultraviolet radiation and aquatic biogeochemical cycles, in: UV Effects in Aquatic Organisms and Ecosystems, edited by: Helbling, E. W. and Zagarese, H., Vol. 1, The Royal Society of Chemistry, Cambridge UK, 137–184, 2003.