the Creative Commons Attribution 4.0 License.
the Creative Commons Attribution 4.0 License.
 | 02 Dec 2019
Environmental controls on marine productivity near Cape St. Francis, South Africa
Mark R. Jury
This study considers ocean–atmosphere influences on marine productivity over the shelf near Cape St. Francis, South Africa. Multiday estimates of chlorophyll fluorescence in the period 2006–2017 with an area outlined by 34.5–33.75∘ S and 24–26.5∘ E provide the basis for evaluation using data from high-resolution reanalyses.
Correlations with the mean annual cycle of chlorophyll fluorescence were significant for salinity, linking marine productivity and the coastal hydrology. A strengthened Agulhas Current induces cyclonic shear that lifts water at the shelf edge. Composite high-chlorophyll-fluorescence events were dominated by a large-scale midlatitude atmospheric ridge of high pressure. The resultant easterly winds caused offshore transport and the upwelling of cool nutrient-rich water in multiday events at the beginning and end of austral summer. Environmental controls on interannual fluctuations of the commercial fishery were also explored. Southwestward currents and diminished heat fluxes favored the squid catch, while anchovy and sardine catches were linked with upper northerly wind, consistent with large-scale weather patterns that underpin coastal upwelling and river discharge. Productivity lags a few days behind cyclonic wind and current shear and the upstream coastal hydrology, which shares a common atmospheric driver.


The southern coast of South Africa is swept by the prevailing warm Agulhas Current (Lutjeharms et al., 2000). Shelf-edge upwelling is induced by cyclonic shear of the current and downstream widening of the shelf (Schumann, 1986, 1987, Lutjeharms, 2006; Goschen et al., 2015; Malan et al., 2018). Coastal winds average 7 m s−1 (Schumann and Martin, 1991) and tend to blow from east in summer and from the west in winter. The easterlies lift cold nutrient-rich water next to three capes: Cape Padrone, Cape Recife, and Cape St. Francis, separating two sheltered bays (Schumann et al., 1982, 2005; Goschen and Schumann, 1988, 2011; Schumann, 1999; Roberts, 2010; Pattrick et al., 2013). Rivers of the Eastern Cape discharge fresh, silty water a rate of up to 100 m3 s−1 during infrequent floods in the Gamtoos, Sondags (Sundays), and Great Fish river valleys (van Bladeren et al., 2007). Their plumes spread along the shore and into the large bays (Scharler and Baird, 2005). Stratification occurs over the shelf during summer due to insolation and milder winds. During winter the stronger westerlies induce surface heat loss and mixing (Schumann and Beekman, 1984). These processes lead to a large seasonal cycle that is punctuated by summertime upwelling. Intraseasonal fluctuations are attributed to pulsing and meandering of the Agulhas Current (Lutjeharms et al., 1989; Lutjeharms and Roberts, 1988; Goschen and Schumann, 1990; Rouault and Penven, 2011) and by coastal low-pressure cells coupled to shelf waves that pass eastward around South Africa, bringing changes in marine weather (Jury et al., 1990; Schumann and Brink, 1990). Air–sea interactions exhibit cross-shore gradients that are important for coastal resources (Beckley, 1988). The inshore bays are sheltered and develop stable layers during summer that aggregate phytoplankton. In this area, known as the eastern Agulhas Bank, a commercial fishery aimed at sardines (67 kt yr−1), squid (3 kt yr−1), anchovy, roman, mackerel, etc. (Roberts et al., 2012; Cochrane et al., 2014) sees most of the catch effort within 50 km of the coast surrounding St. Francis Bay (34∘ S, 25∘ E), which offers protection from persistent SSW swells (avg. 2.3 m).
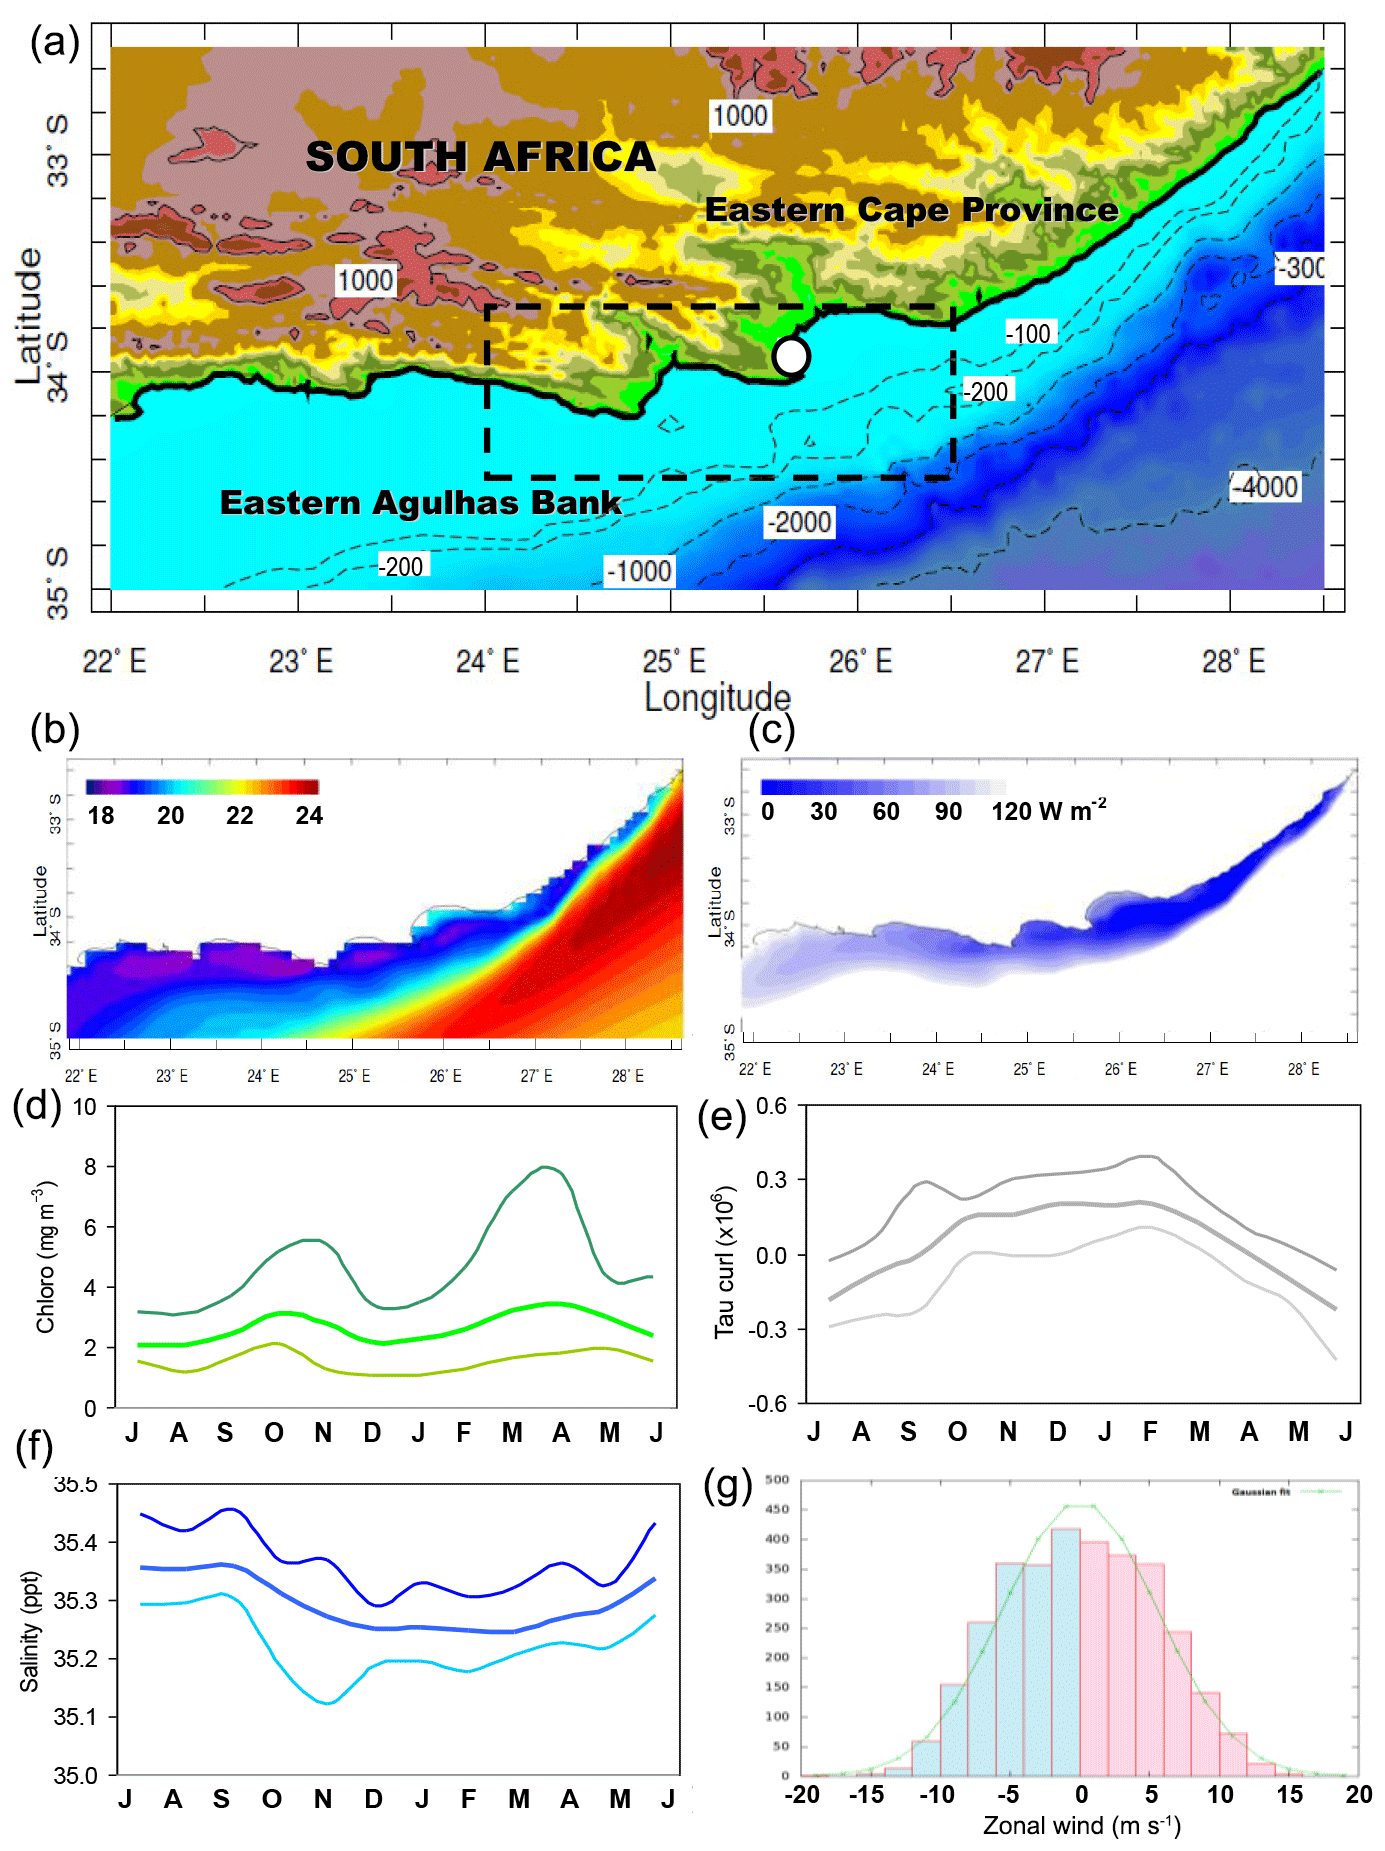
Figure 1(a) Topography of the outer study domain (and dashed index area), shelf bathymetry, and Port Elizabeth (dot). Mean maps, 2006–2017, of HYCOM reanalysis (b) SST (∘C) and (c) net heat flux (shaded < 120 W m−2). Index-area mean annual cycle of (d) chlorophyll fluorescence, (e) wind stress curl, and (f) salinity, with upper and lower 2.5 percentiles; summer is unified. (g) Histogram of index-area daily zonal wind, (blue is from east and red is from west).
This study considers marine productivity at multiday timescales off Cape St. Francis, South Africa. Using high-resolution model-assimilated observations, our analysis seeks to understand how environmental conditions modulate chlorophyll and salinity. Section 2 covers the data and methods, and Sect. 3 presents the results progressing from mean features and statistics to case studies of productive events. Context is provided by temporal cross-correlations, spatial point-to-field regression and statistical comparison of commercial fish catches with environmental variables. Section 4 provides a discussion that relates the biochemistry indices to ocean–atmosphere forcing.
This study is focused on the eastern Agulhas Bank during the period of high-resolution satellite coverage. Ocean conditions off Cape St. Francis, South Africa (32.5–35∘ S and 22–28.5∘ E, Fig. 1a), were described using multiday SODA3 (25 km horizontal resolution; Carton et al., 2018) and daily HYCOM (GOFS3.1) reanalysis (9 km; Chassignet et al., 2009). These reanalyses (see Appendix) assimilate in situ observations from ship, buoy and drifter, and satellite infrared and microwave radiometer measurements over a multiday period to produce a hindcast with a vertical resolution of < 5 m near the surface. Local validations are reported in Jury and Goschen (2019). Sea surface temperature (SST) was assimilated via daily 1 km infrared and 9 km microwave data after de-clouding and calibration (Chin et al., 2017). Salinity was assimilated via wide-swath passive microwave radiometers, while multiple zenith-pointing radar altimeters determined sea surface height (SSH) and near-surface currents. Chlorophyll was estimated from MODIS satellite 4 km resolution green-band data, atmospheric corrected using an 8 d composite maximum, and adjusted for radiometer drift (Hu et al., 2012). Similarly, the fluorescence line height was estimated from level-3 MODIS red-band data, which is less sensitive to coastal sediments (Gower, 2016; Houskeeper and Kudela, 2017). Swell characteristics were derived from the WaveWatch III hindcast (Tolman, 2002). Atmospheric conditions were described using daily MERRA v2 reanalysis (50 km resolution; Gelaro et al., 2017). Winds were assimilated from station, ship and buoy measurements, blended with satellite cloud drift and active microwave scatterometer retrievals. The ocean reanalyses are embedded within the coupled data assimilation system: HYCOM from the US Navy Coupled Ocean Data Assimilation (NCODA) (Cummings and Smedstad, 2013), and SODA3 from MERRA2 that incorporates hydrology and air chemistry (Reichle et al., 2017).
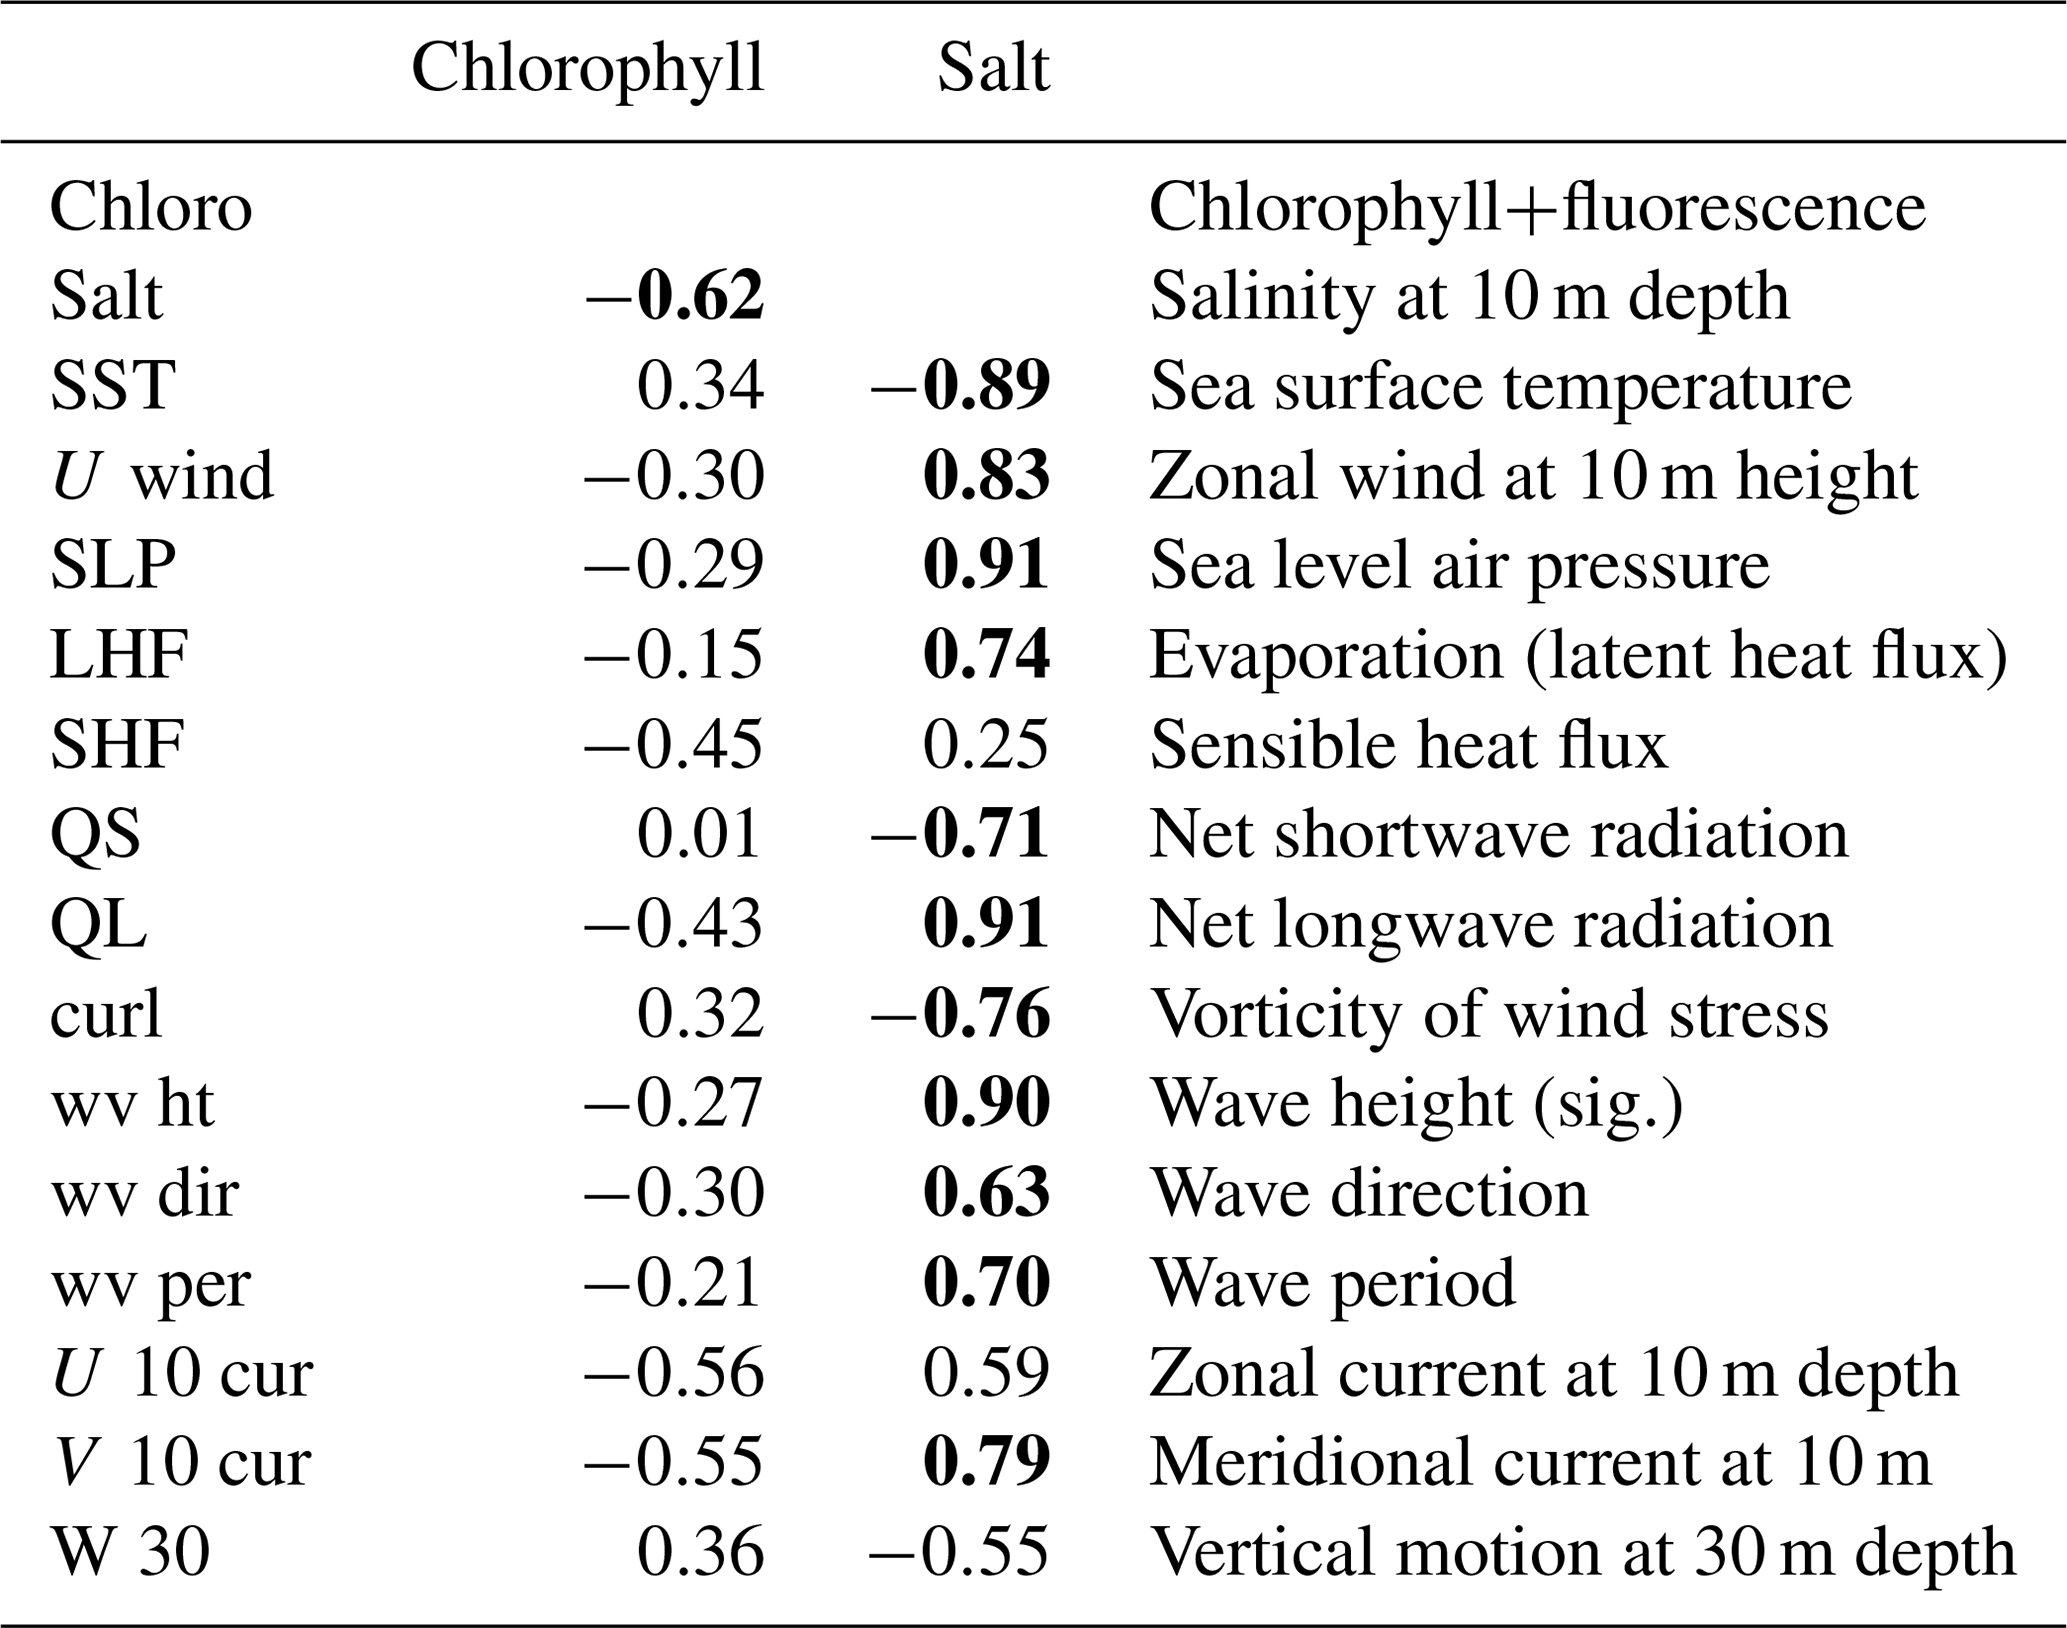
Table 1Pairwise correlation values for the mean annual cycle averaged over the index area, 2006–2017. N=46 at 8 d resolution; significant values are bold.
Daily and 8 d temporal records were extracted for an index area, 33.75–34.5∘ S and 24–26.5∘ E, encompassing the shelf around Cape St. Francis, South Africa (see Fig. 1a). With two large bays, a widening shelf, and the offshore Agulhas Current, the index area is subject to a variety of processes. The analysis was confined to the period 2006–2017, when high-resolution satellite coverage of the shelf zone facilitates analysis of SST, winds, and currents. The coastal hydrology was described by CHIRPS v2 rainfall (5 km resolution; Funk et al., 2015), CMORPH satellite rainfall (25 km; Joyce et al., 2004), and SADW discharge records for the Gamtoos, Sondags, and Great Fish rivers. The marine variables include SST, sea level air pressure (SLP), winds, heat and radiation fluxes, salinity, currents, and vertical motion (see Table 1). An 8 d resolution compatible with MODIS chlorophyll fluorescence yields a record length of 552 comprised of 46×12 years (1 January 2006–31 December 2017). From this, multiday events were identified by ranking the index-area chlorophyll fluorescence and salinity at 10 m depth. The chlorophyll fluorescence time series was subjected to wavelet spectral analysis to determine the degree of cyclicity and its amplitude and period.
Statistical associations were studied by pairwise correlations of the mean annual cycle of chlorophyll fluorescence and 10 m salinity with a variety of environmental parameters listed in Table 1. Statistical significance above 90 % confidence was achieved with the Pearson-product moment r > for 6 degrees of freedom. Relationships with chlorophyll fluorescence motivated a point-to-field correlation analysis of the salinity record and large-scale fields of October–March sea level air pressure, covering 25–45∘ S and 10–43∘ E, 2006–2017. A composite average of the top-10 chlorophyll fluorescence events was conducted to study anomaly patterns for 500 hPa geopotential height, satellite rainfall, and surface zonal winds. Composite maps were analyzed sequentially at −4, −3, −2, −1, 0 d before the time of peak ocean color to reveal the large-scale atmospheric forcing. The top-10 events began on the following dates: 1 November 2009, 1 November 2014, 24 October 2014, 24 October 2009, 17 May 2015, 19 December 2007, 9 November 2014, 23 October 2012, 10 February 2011, and 23 April 2015, ranked by value. Exploratory analysis of the Agulhas Current pulses (see Appendix Fig. A2) was made by calculating HYCOM daily sea surface height variance during 2006–2017 per 0.1∘ longitude bin from 24–29∘ E to 34.5∘ S and via case study Hovmöller sequences across the shelf.
Interannual fluctuations of commercial fisheries and environmental conditions were explored using monthly ocean reanalysis appropriate for longer timescales: January–June season SODA v3 ocean reanalysis (Carton et al., 2018), satellite SST (Chin et al., 2017), and annual catch data from local and international sources (van Zyl and Willemse, 2000; Janet Coetzee personal communication, 2018). Pairwise correlations were calculated for the main fishery species in the period 1981–2015; 90 % confidence is reached with r > for 35 degrees of freedom. The websites used for data extraction and analysis are listed in the acknowledgements. This work represents one of the first applications of fine-scale reanalysis to the shelf zone of South Africa.
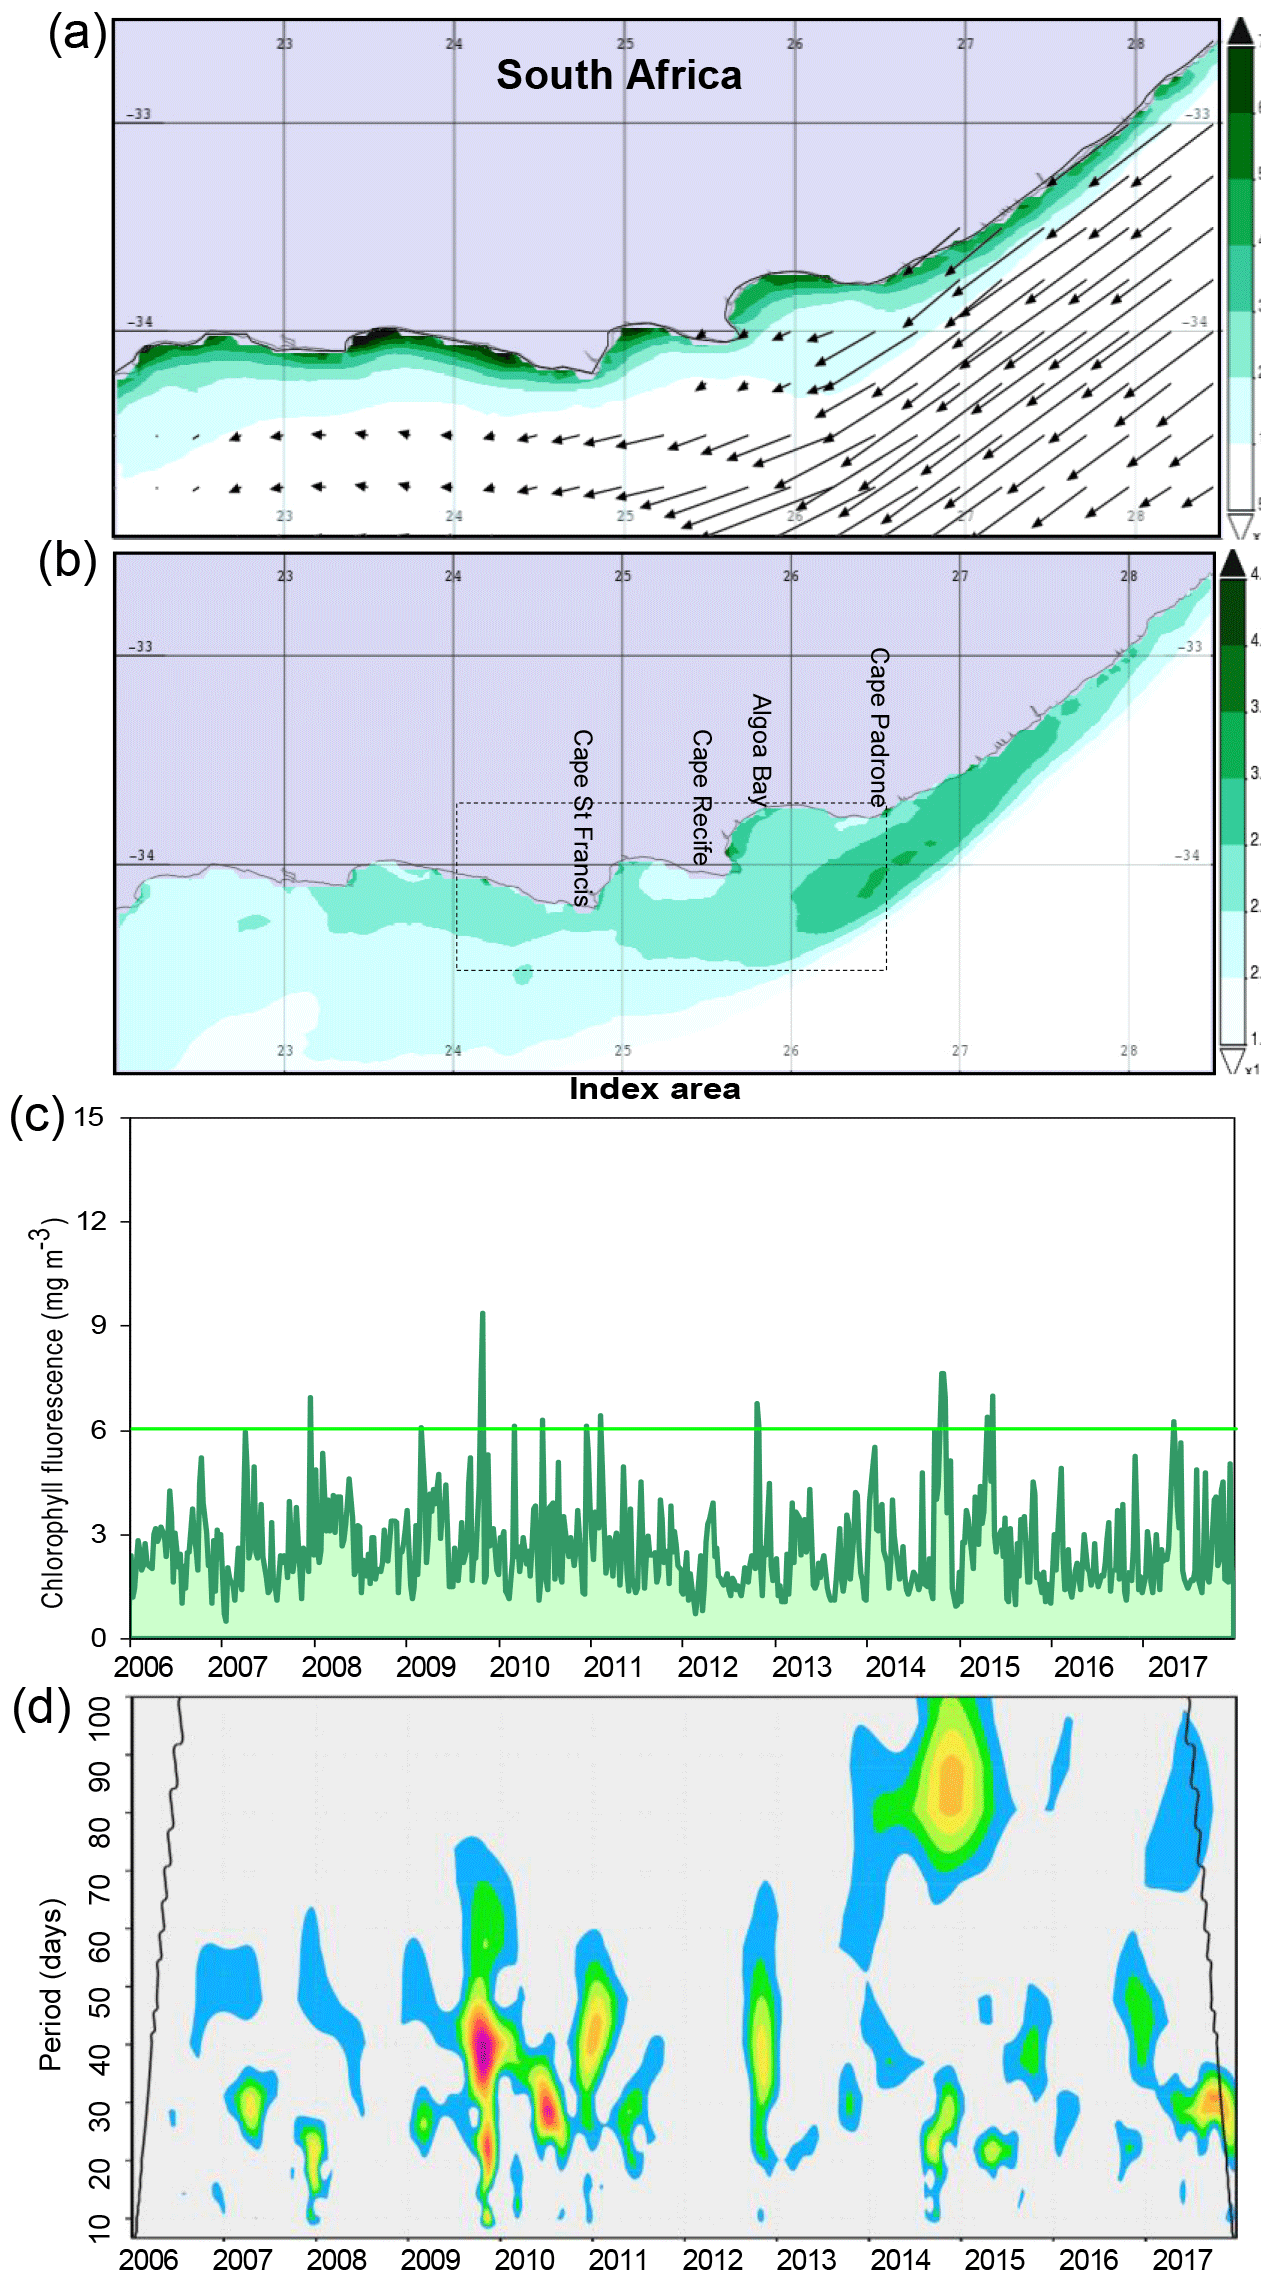
Figure 2MODIS 2006–2017 mean (a) chlorophyll concentration (mg m−3) with SODA3 mean near-surface currents and (b) fluorescence line height (W m2) and index area. (c) Time series of 8 d index-area chlorophyll fluorescence; composite cases > 6 mg m−3. (d) Wavelet spectra energy of the time series, shaded from 90 % to 99 % confidence.
3.1 Marine climate and annual cycle
Mean maps of the study area topography and SST are illustrated in Fig. 1a and b. Sharp gradients in the mean SST field were evident: inshore waters are 17–19 ∘C, while offshore waters are 22–24 ∘C. Shelf-edge upwelling next to the warm Agulhas Current divided the two regimes (Lutjeharms et al., 2000; Malan et al., 2018). Over the cool inshore waters, the sensible heat flux was low (Fig. 1c), and the atmospheric boundary layer was shallow (800 m). So the coastal topography steers the wind towards a longshore axis (Schumann and Martin, 1991) that further sharpens the gradients.
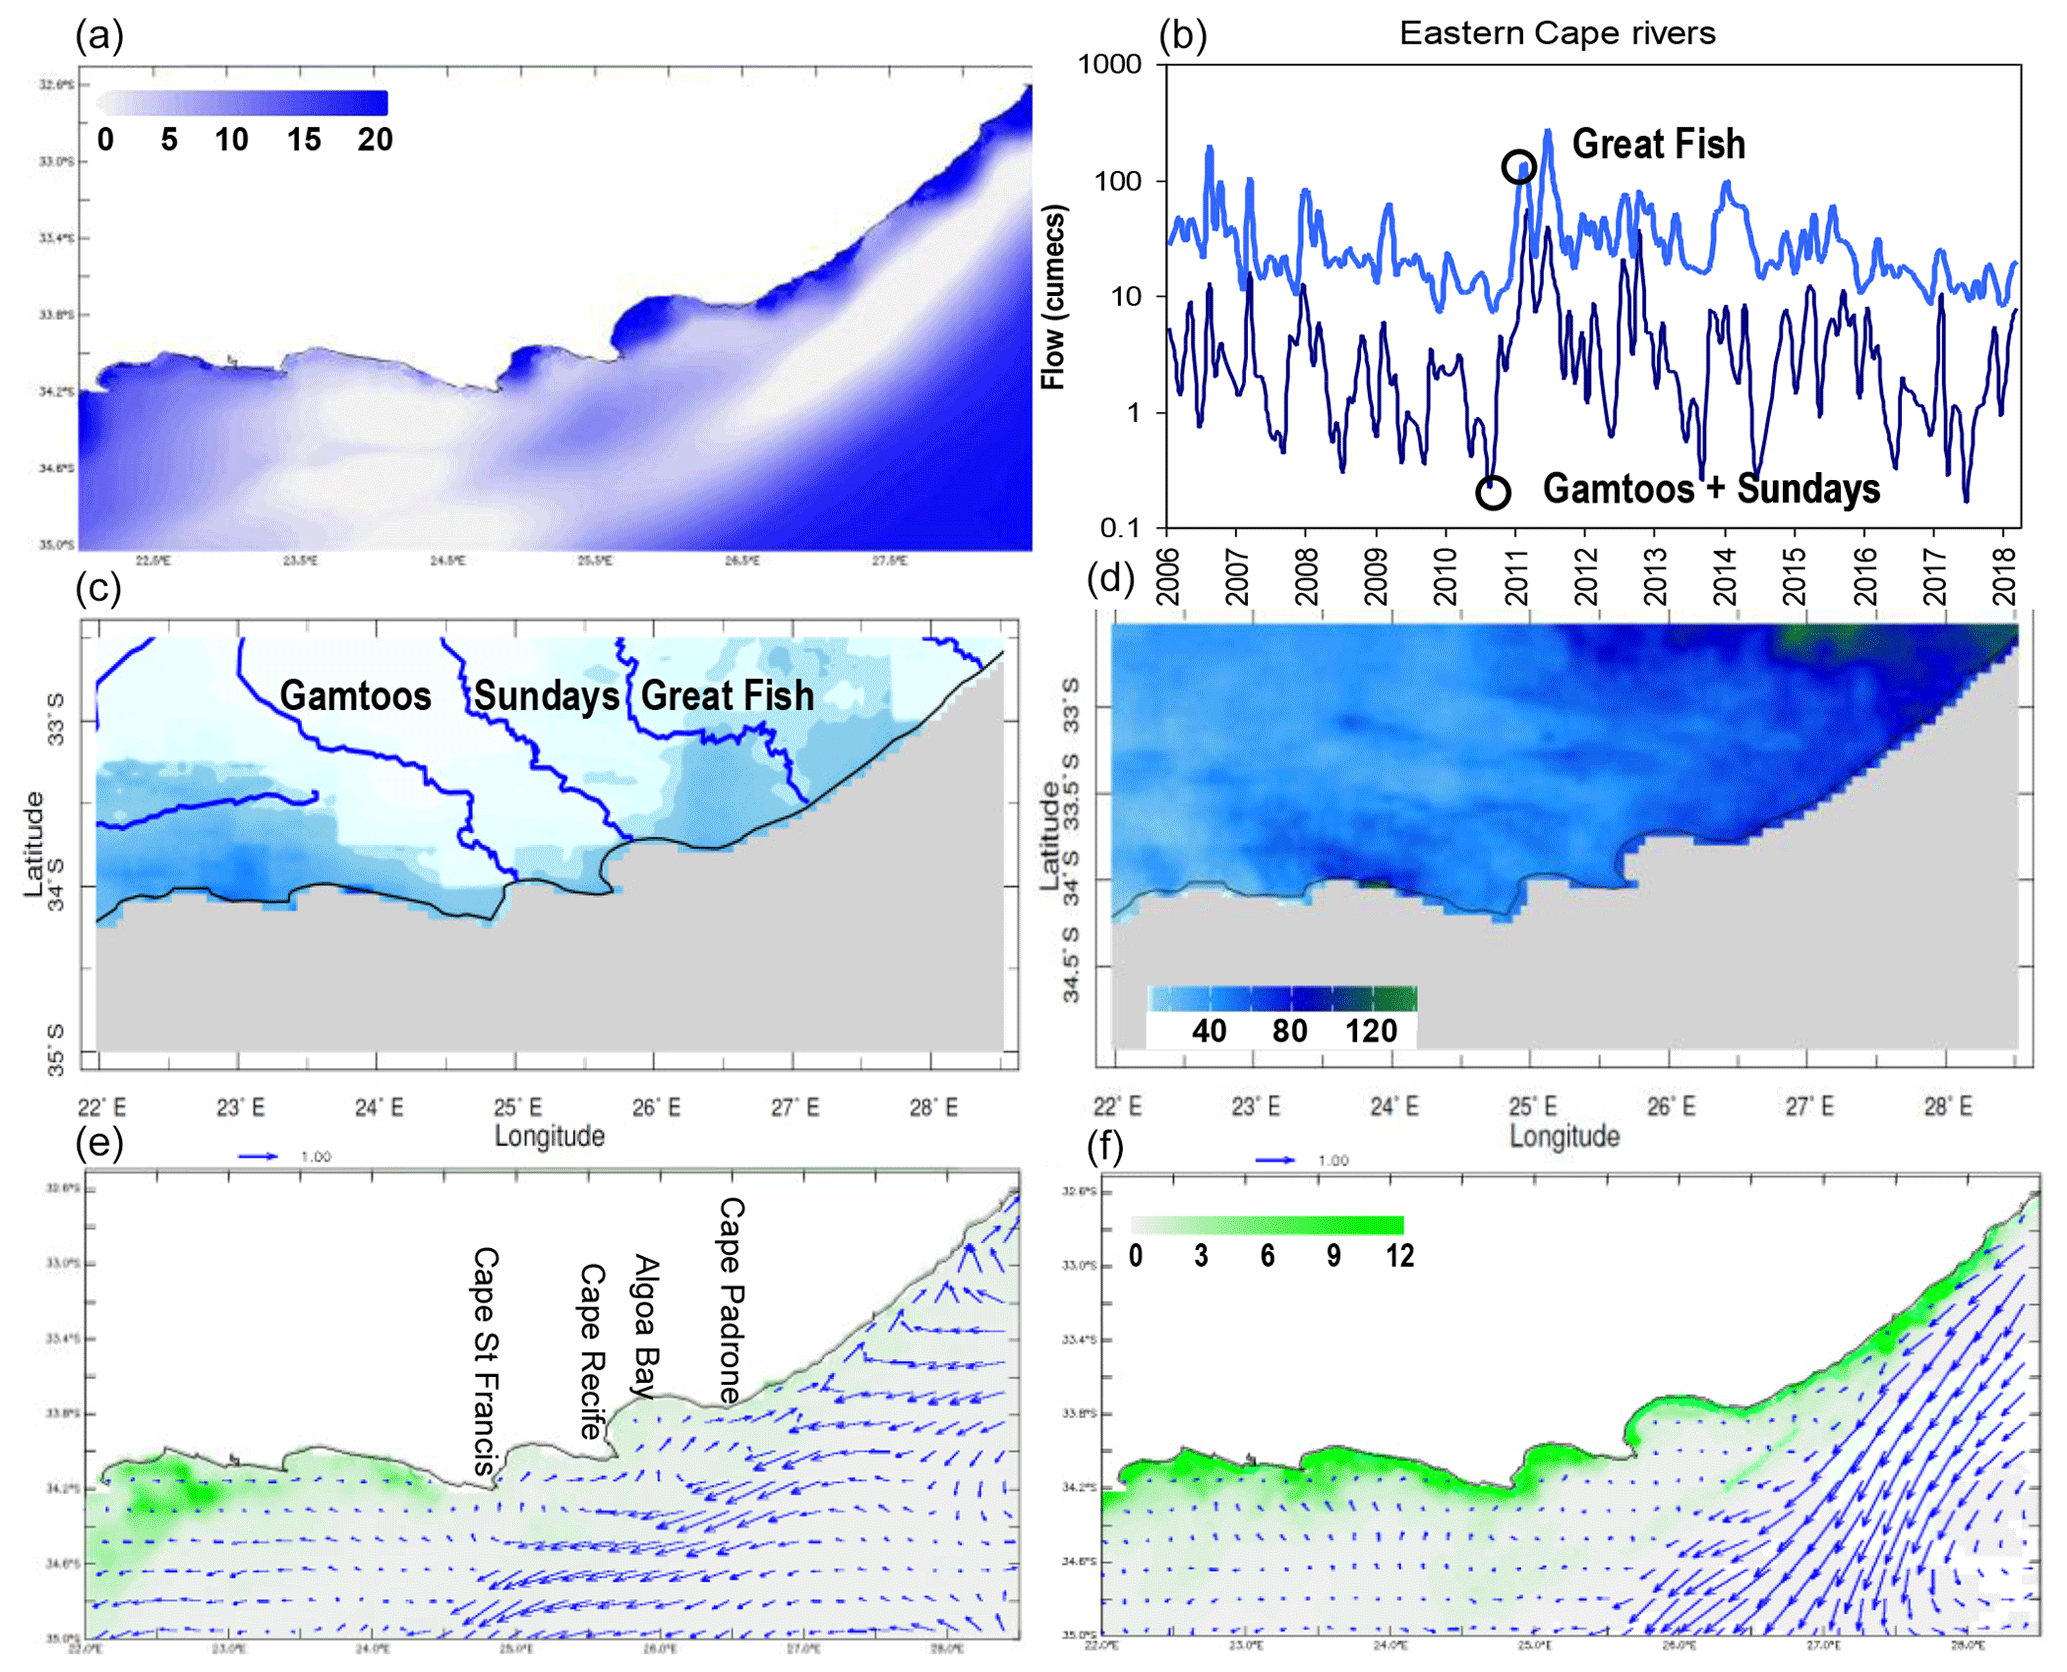
Figure 3(a) Mean 2006–2017 HYCOM water flux into ocean (mm d−1). (b) Observed monthly river discharge at the coast, with dry spell (1–10 August 2010) and wet spell (1–10 March 2011) (circled). (c, d) CHIRPS coastal rainfall (cumulative, mm), (e, f) MODIS chlorophyll (shading), and HYCOM near-surface current vectors during the dry spell (left) and wet spell (right). (c) Illustration of the main rivers.
Figure 1d–f illustrate the mean annual cycle of key variables. Chlorophyll fluorescence showed bimodal peaks in October–November and March–April, of importance to the marine food web and fishery abundance (Shannon et al., 1984; Hutchings 1994). The wind stress curl reached a cyclonic condition from October to March that favored upwelling via easterly wind shear attending subtropical high pressures. During winter season, anticyclonic curl via westerly wind shear promoted downwelling. The annual cycle of 10 m salinity revealed a summer minimum, induced by greater rainfall and river discharge from November to March. A histogram of daily zonal winds (Fig. 1g) showed a near-equal occurrence of upwelling (−U) and downwelling-favorable conditions and many instances of 5–10 m s−1 in both eastern and western sectors. A case study upwelling event with high chlorophyll fluorescence during 24 October–8 November 2009 is illustrated in the Appendix (Fig. A1), and it links easterly winds, rainfall, and marine productivity.
3.2 Chlorophyll and water flux
The mean MODIS chlorophyll and fluorescence maps (Fig. 2a, b) show higher values inshore and downstream from the capes, and lower values outside of the Agulhas Current. The chlorophyll tended to hug the coastal zone and its wave- and river-suspended sediments. In contrast, the fluorescence exhibited an offshore plume from Cape Padrone, associated with shelf-edge upwelling. The chlorophyll fluorescence index-area time series (Fig. 2c) is punctuated by spikes of 10 mg m−3, which identify key events mainly at the beginning and end of summer. Its wavelet spectral energy (Fig. 2d) exhibited fluctuations from 20 to 45 d in early and late summer bursts. The years 2009–2011 experienced greater 20–50 d pulsing, while 80–90 d oscillations of chlorophyll fluorescence characterized the years 2014–2015 and 2017. At 8 d resolution, higher frequencies were unresolved.
The mean HYCOM water flux into the ocean (Fig. 3a) exhibited a low axis along the shelf edge. Marine rainfall was a feature outside and east of the Agulhas Current. Significant river discharges on the upstream coast and in the bays were measured (Fig. 3b). The Gamtoos–Sondags output was 1–10 m3 s−1, while the Great Fish River reached ∼100 m3 s−1 during wet spells. Yet there were prolonged dry spells characterized by minimal discharge. The case study section considers seasonal changes from 2010 to 2011 and a detailed analysis of an event in 2014.
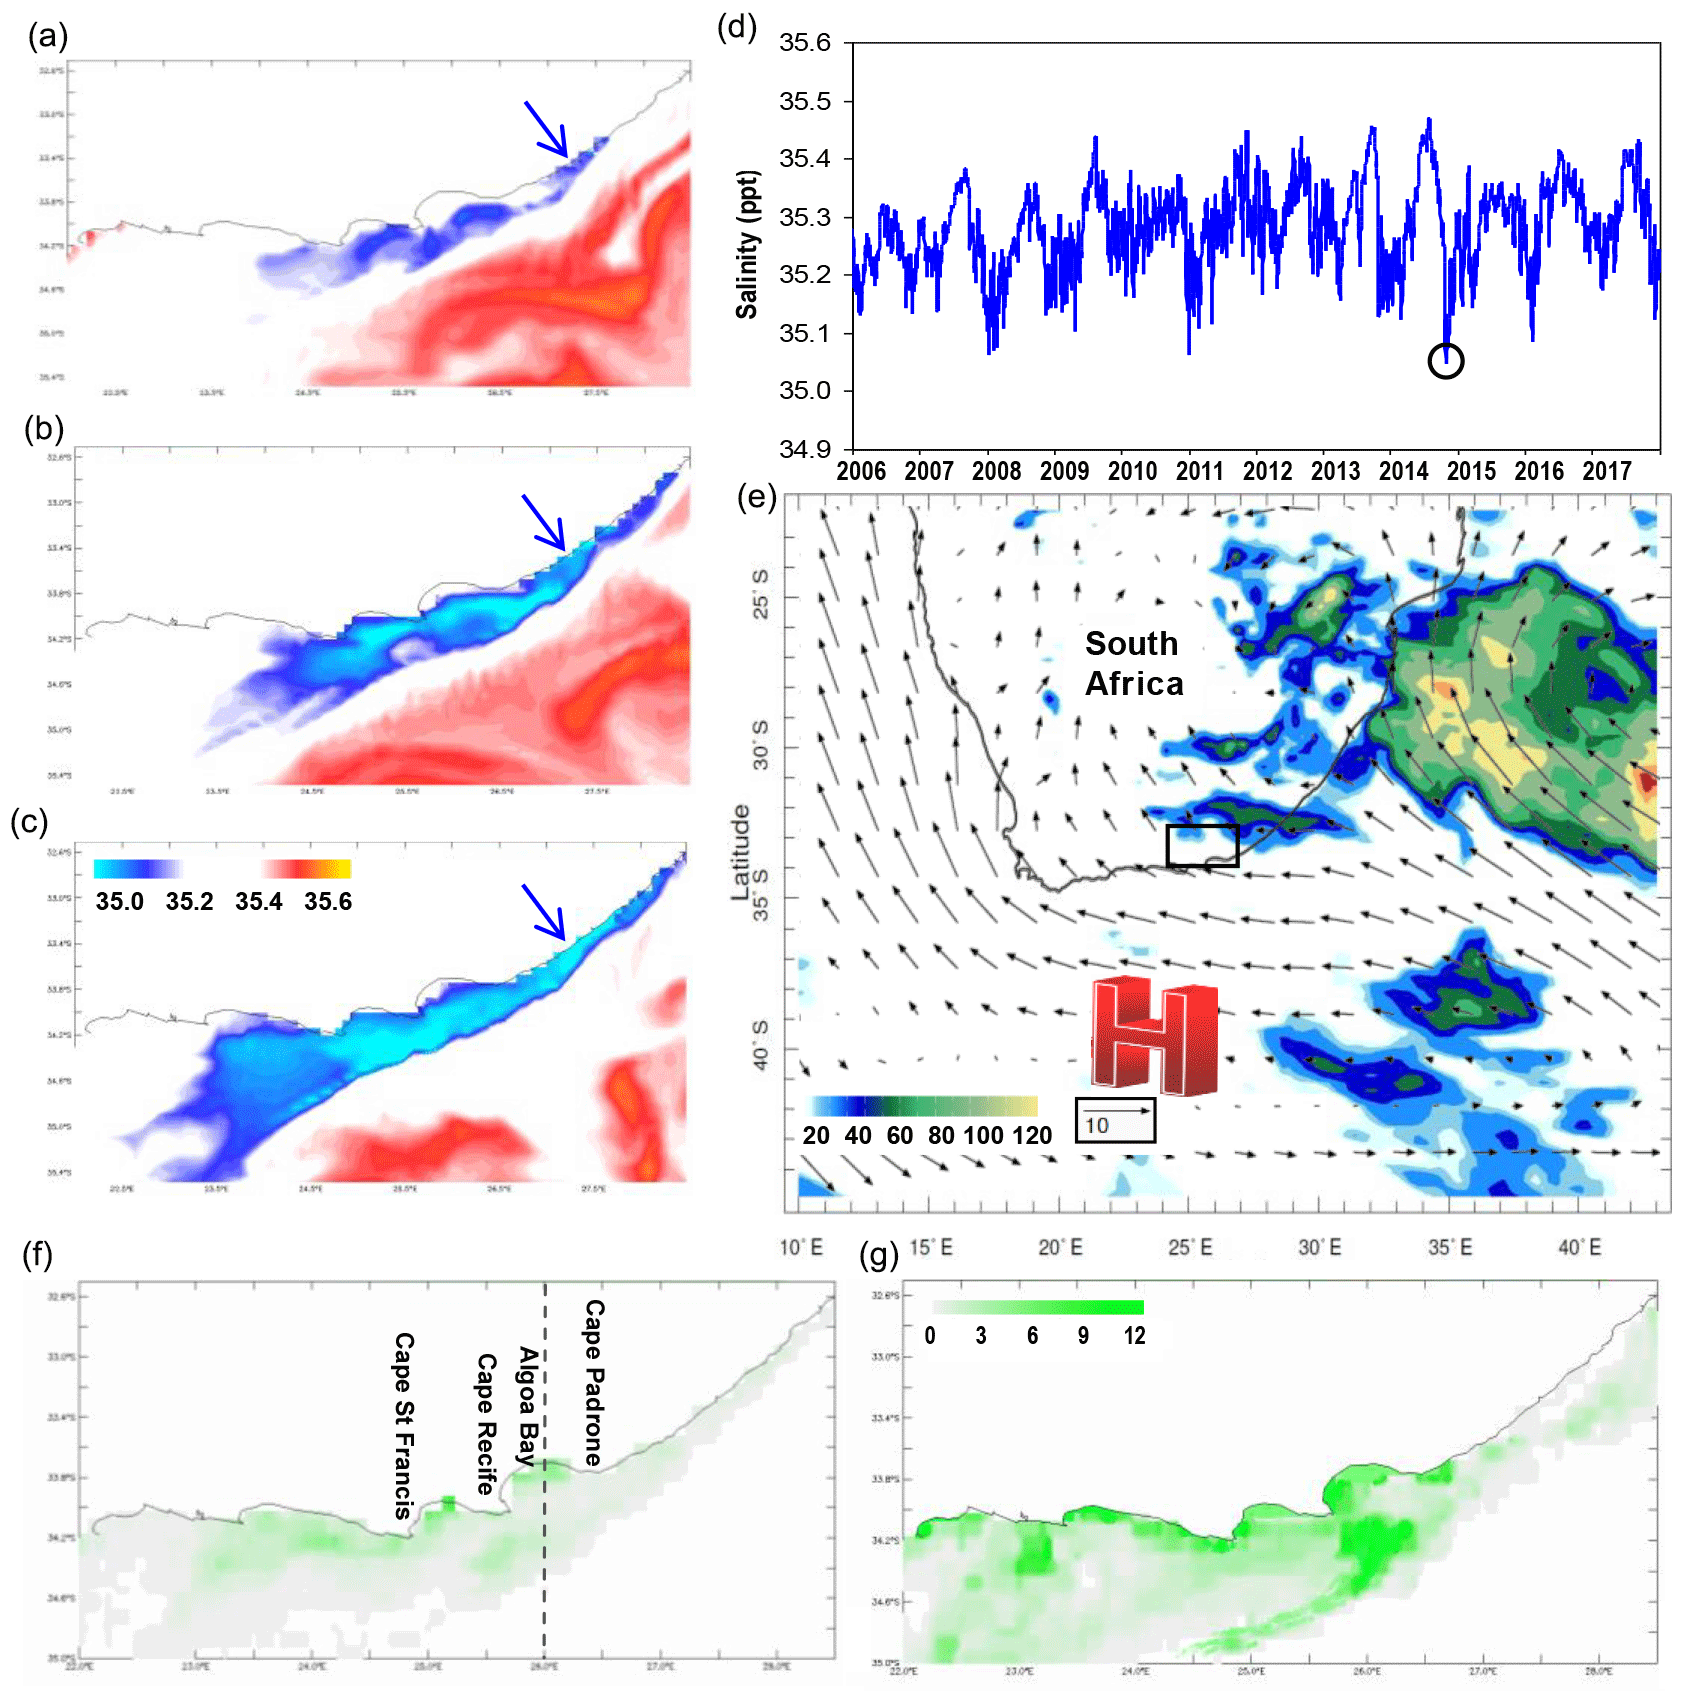
Figure 4Salinity maps (a) 15–20 October, (b) 20–25 October, and (c) 25–30 October 2014 when the cumulative Great Fish River discharge exceeded 1010 m3. (d) Daily record of index-area 10 m salinity, with case study circled. (e) Large-scale 15–25 October 2014 cumulative CMORPH rainfall (shaded, mm) and low-level winds (vector). MODIS chlorophyll: (f) 8–23 October and (g) 24 October–8 November 2014. Arrow in (a)–(c) is the Great Fish River mouth. Dashed line in (f) is the section in Fig. 5.
3.3 Case study productivity and salinity events
The river discharge time series reflects a period of change from dry to wet conditions from August 2010 to March 2011. Rainfall maps for those contrasting periods (Fig. 3c, d) exhibited dry conditions over the Eastern Cape followed by widespread rainfall. River discharges rose from 1 to ∼100 m3 s−1 and the shelf exhibited increased chlorophyll (Fig. 3e, f). The main axis of the Agulhas Current was inshore early in the event and shifted seaward later in the event. Initially there was northeastward flow along the coast that diminished later.
Figure 4a–g follow the development of a low-salinity event from 15 to 30 October 2014. Initially there was higher salinity water over the shelf but gradually the upstream rainfall and river discharges (∼35 m3 s−1) fed southwestward into a buoyant plume. By the end of October 2014, the near-surface salinity over the shelf declined to 35.0 ppt. The daily 10 m salinity record reveals this event to be the lowest in a decade. The low-salinity waters over the shelf appear consistent with those observed after an extended period of coastal upwelling when high chlorophyll joins the seaward side of cold plumes originating from the capes. The large-scale wind map shows SE flow over South Africa, driven onshore by a trough in the Mozambique Channel and a midlatitude high-pressure cell (Fig. 4e). Marine rainfall > 100 mm covered the upstream Agulhas Current. Subsequently, there was a noteworthy increase in chlorophyll from mid-October to early November 2014 (Fig. 4f, g). An increase in upstream rainfall and runoff promoted water turbidity and marine productivity.
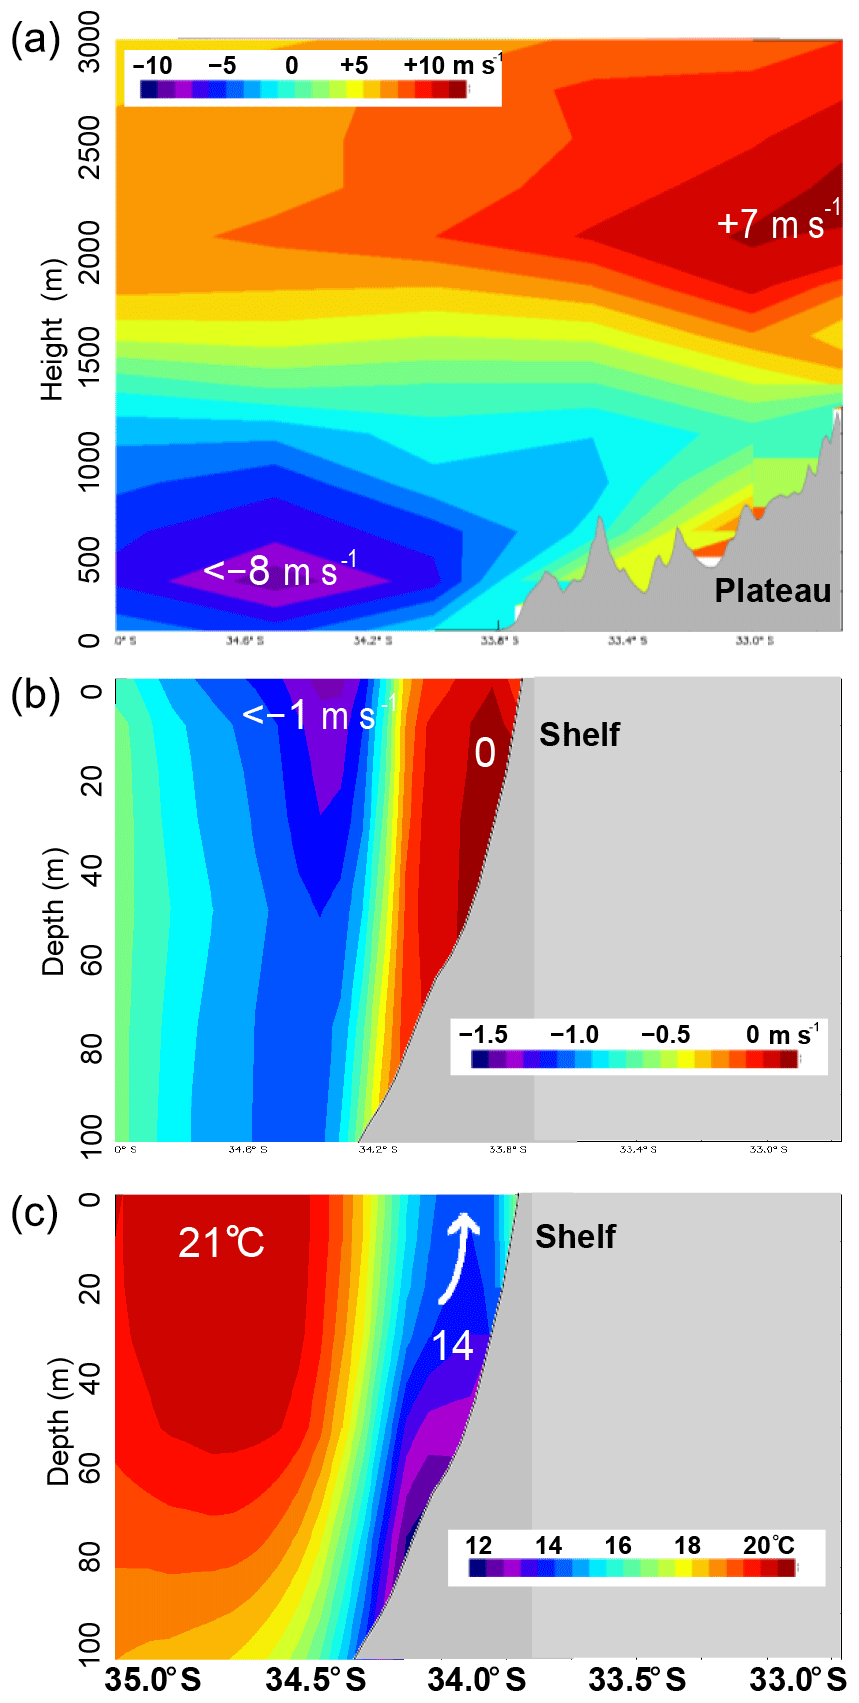
Figure 5Vertical N–S sections on 26∘ E averaged during 15 October–5 November 2014 of (a) MERRA2 zonal wind, (b) HYCOM zonal current, and (c) sea temperature.
Vertical sections of zonal wind, currents, and sea temperature are shown in Fig. 5a–c, averaged over the high chlorophyll event (late October 2014). Along the 26∘ E longitude these sections identify the easterly low-level jet over the shelf and associated cyclonic wind shear. The upwelling-favorable easterly winds were vertically capped at 850 hPa (1.5 km). The wind stress vorticity was N m−3, lifting water near the coast. The vertical section of zonal currents revealed a westward Agulhas Current of 1.4 m s−1 between 34.7 and 34.3∘ S. Near the coast zonal currents were zero, hence the cyclonic vorticity at 34.2∘ S was s−1, lifting water at the shelf edge. The sea temperature section exhibited warm 21 ∘C sea temperatures offshore, typical of the Agulhas Current during spring. Inshore there was pronounced upwelling of 12 ∘C water lifted from ∼80 m depth at 34.1∘ S, breeching the surface layer with a temperature of 14 ∘C.
Vertical motion is generated by vorticity within the longshore wind stress ζτ and current ζU10 (Hsueh and O'Brien, 1971; Gill and Schumann, 1979; Blanton et al., 1981; Brink, 1998) according to (CDZ∕fdt). Using the above vorticity values, water density (ρ) is 103 kg m−3, coriolis parameter (f) is s−1, bottom drag (CD) is 10−2 (Liu and Gan, 2015), and depth of current shear (Z) is 2×10² m, over a multiday time (dt) of 105 s. The wind stress curl and the current shear each generate vertical motion of m s−1. In the 2014 case study, the easterly winds and currents combined to lift water off Cape Padrone. Yet half of the time winds are from the west (see Fig. 1g) and oppose the current-induced upwelling.
An exploratory analysis of processes underpinning shelf-edge upwelling was made. Appendix Fig. A2 illustrates that variance of sea surface height is greatest outside the Agulhas Current. Hovmöller plots of sea surface height during peak chlorophyll fluorescence events exhibited gradual strengthening of the cross-shelf gradient, as pulses of positive SSH moved westward at ∼0.2 m s−1 outside the Agulhas Current and wind-driven offshore Ekman transport induced negative SSH inshore. Zonal winds during these productivity events were net easterly (upwelling favorable) but fluctuated from +11 to −16 m s−1.
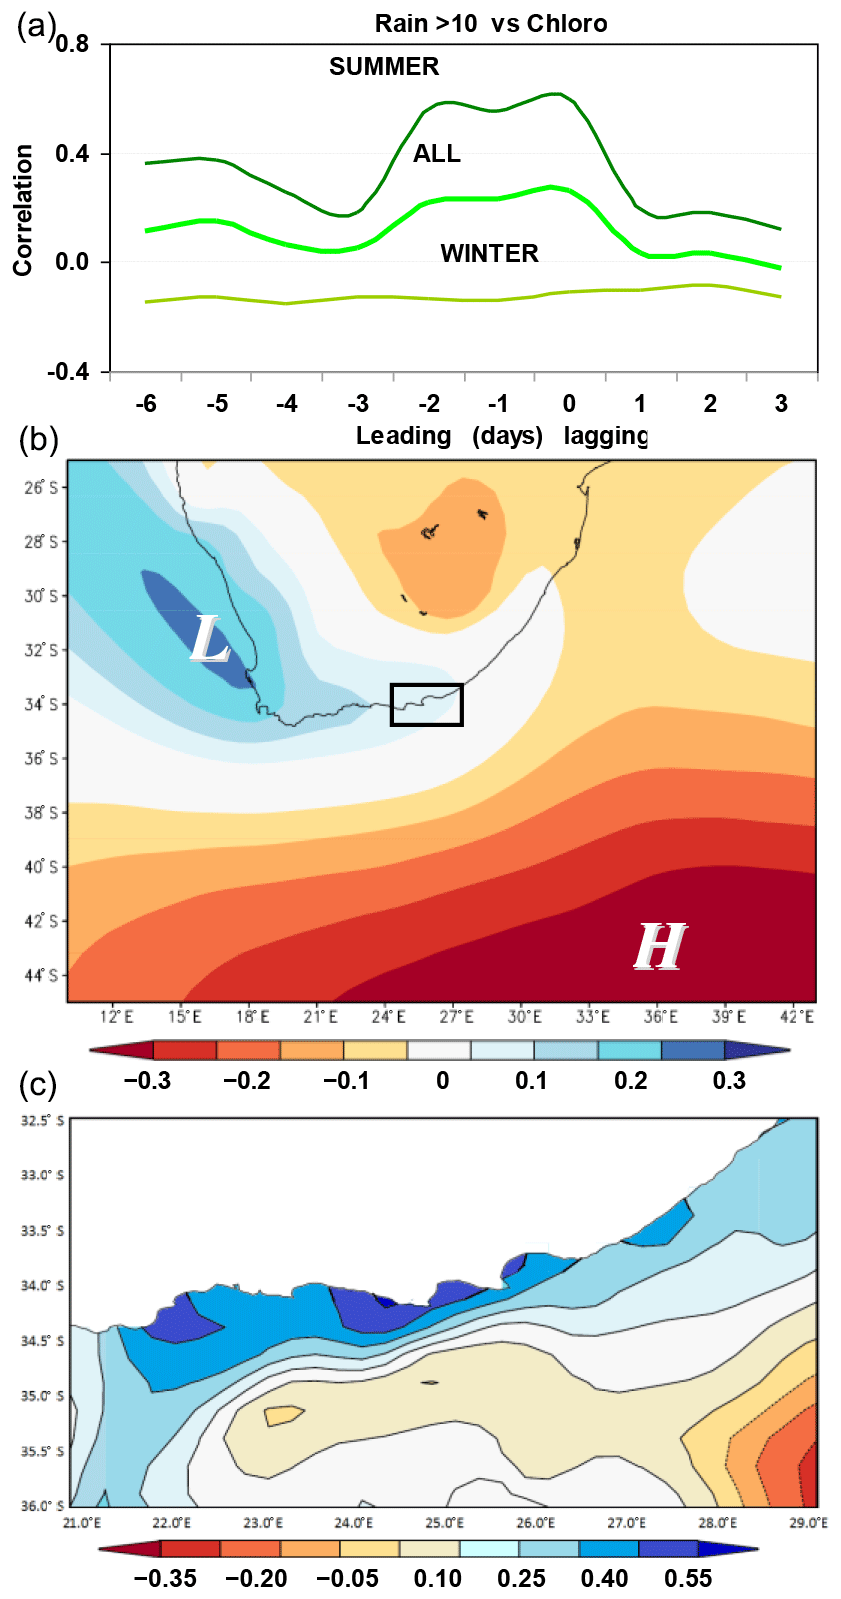
Figure 6(a) Lag correlations between index-area coastal rainfall > 10 mm d−1 and chlorophyll fluorescence (N=102) for summer, all, and winter seasons. (b) Point-to-field correlations of salinity index (see Fig. 4d) and sea-level air pressure at 3 d lead, based on October–March 2006–2017 data; icons are given with respect to lower salinity. (c) Same point-to-field correlations except with sea surface height anomalies, shaded with respect to lower salinity (e.g., low inshore).
3.4 Statistical insights
The statistical analysis of temporal records reveals a link between coastal rainfall > 10 mm d−1 and chlorophyll (Fig. 6a), particularly in summer (r > 0.6) when runoff is greater. According to the point-to-field correlation map (Fig. 6b), reduced salinity during summer is associated with a low-pressure trough over the Benguela and a high-pressure system in the midlatitudes southeast of Africa, which together promote upwelling-favorable easterly winds. The correlation map with respect to sea surface height anomalies (Fig. 6c) shows that reduced salinity is linked with a low-inshore high-offshore gradient, hence accelerated shelf-edge currents and shear-induced upwelling.
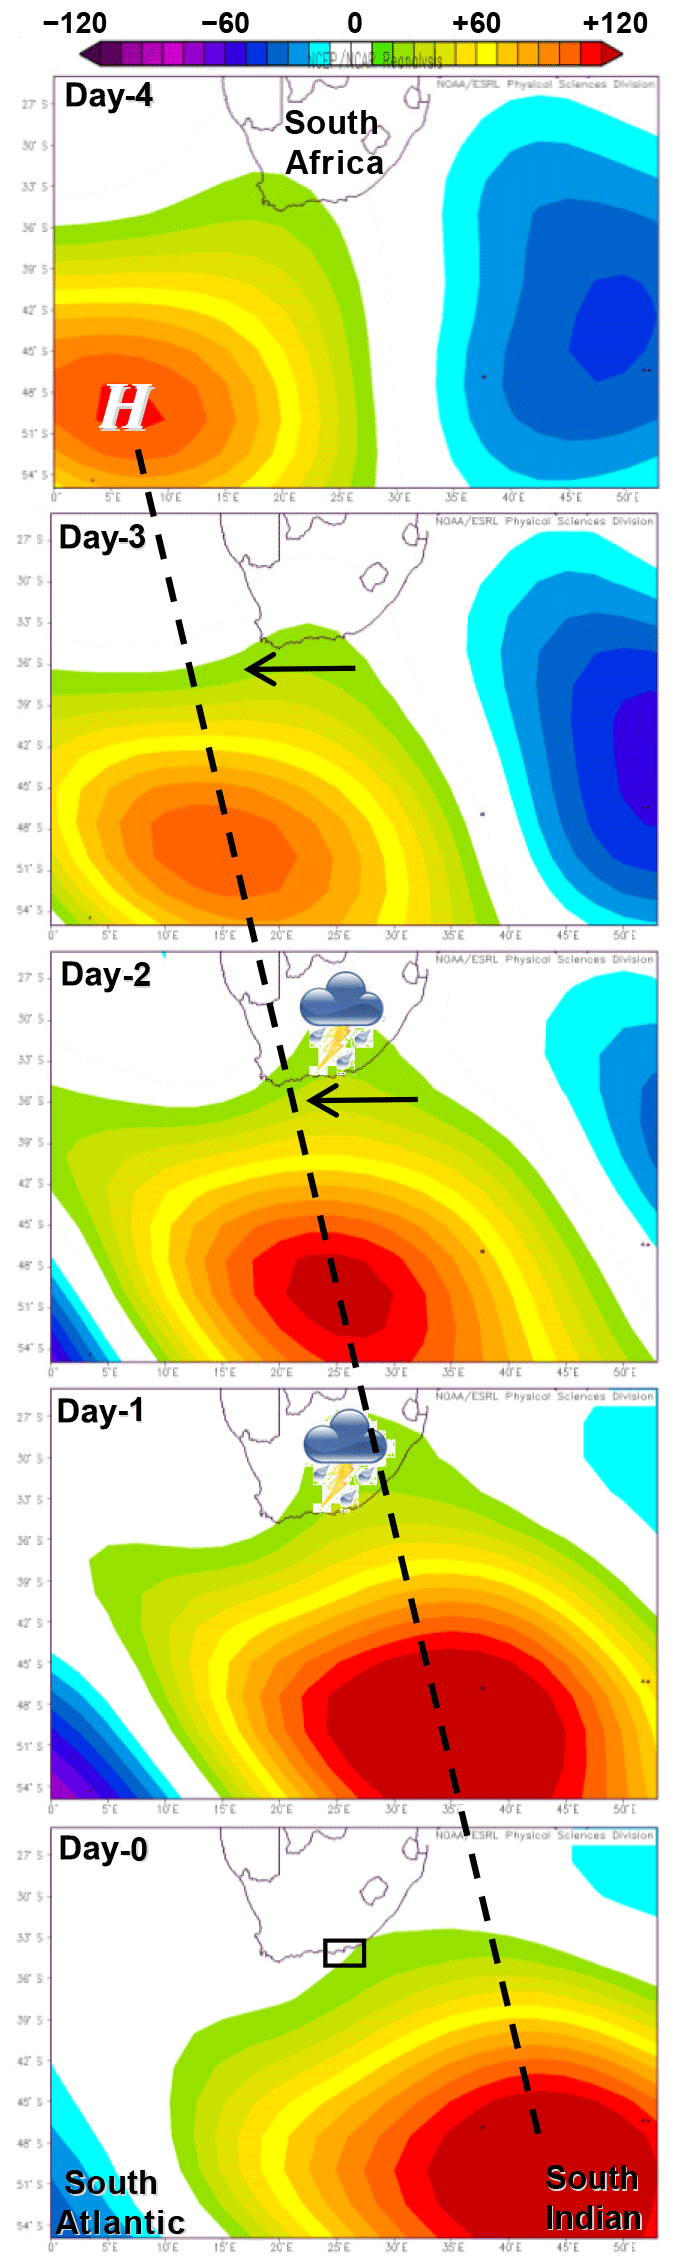
Figure 7Composite 500 hPa geopotential height anomalies (shaded) for the top-10 chlorophyll fluorescence events, (top down) from −4 d (before) to zero (color max), with dashed line following the midlatitude ridge. Composite anomaly easterly winds (> 10 m s−1) and heavy rainfall (> 50 mm) are represented by the arrow and icon, respectively; index area is shown by the black box in the lower panel.
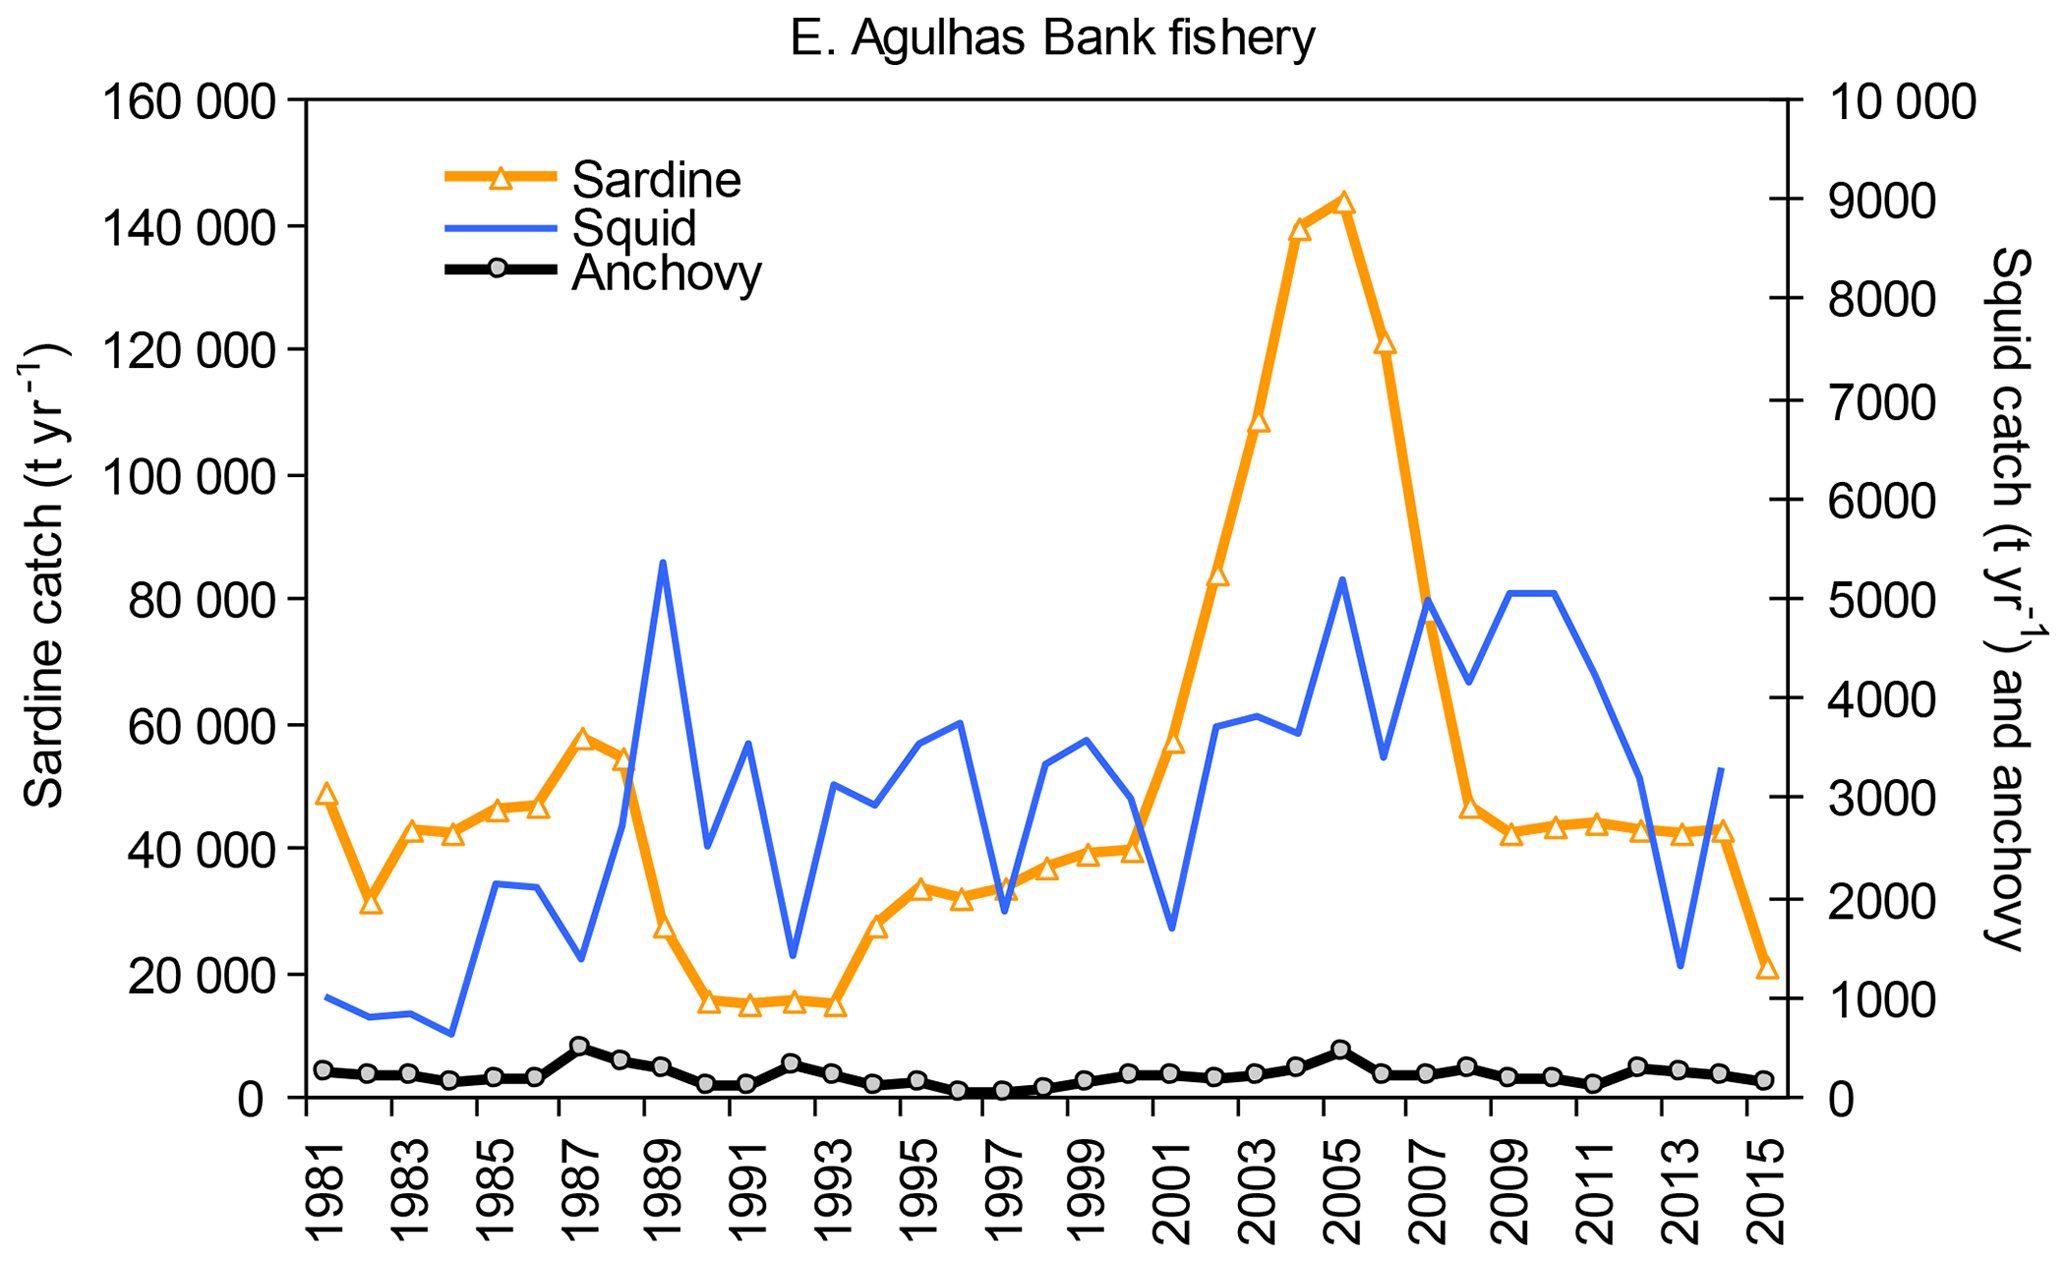
Figure 8Time series of annual catches for leading fisheries in the eastern Agulhas Bank (outer domain covered by, Figs. 1a and 2a); this is the basis for results in Table 2.
Figure 7 illustrates a sequence of composite 500 hPa geopotential height anomalies for the top-10 chlorophyll fluorescence events. The maps follow the eastward movement of a midlatitude ridge, from 4 d before to the day of maximum color in the index area. The ridge moved 10∘ longitude per day on 50∘ S, and it generated easterly wind anomalies of 10 m s−1 on the shelf edge and heavy rainfall over the Eastern Cape interior. Hence large-scale weather conditions promoted marine productivity through the concurrence of upwelling and river discharge.
Table 1 lists the pairwise cross-correlations of mean annual cycle chlorophyll, salinity, and other variables from the index area. Chlorophyll fluorescence is most correlated with salinity () followed by meridional and zonal current (−0.56). Processes that enhance chlorophyll fluorescence over the annual cycle are water mass freshening and an intensified Agulhas Current (see Figs. 6c, A2). For salinity, annual cycle correlations were generally higher. The strongest relationships were with sea level air pressure (r=0.91), net longwave radiation (0.91), and wave height (0.90), indicating that lower air pressure, less outgoing radiation (e.g., greater cloudiness), and smaller wave height coincided with lower salinity over the annual cycle. Storm-induced waves peak from May to September (Jury, 2019), whereas rainfall and runoff are greatest in summer.
Table 2Pairwise correlations of annual fish catch in the outer domain (see Fig. 8) and January–June marine data averaged over the index area, 1981–2015. N=35 at 1 year resolution; significant values are bold. Variables are the same as in Table 1, except Temp. is sea temperature at 10 m depth and U2 and V2 wind are the upper-level wind components (200 hPa) from MERRA2. SST is derived from NOAA, rainfall is from CHIRPS2, and other variables are from SODA3.
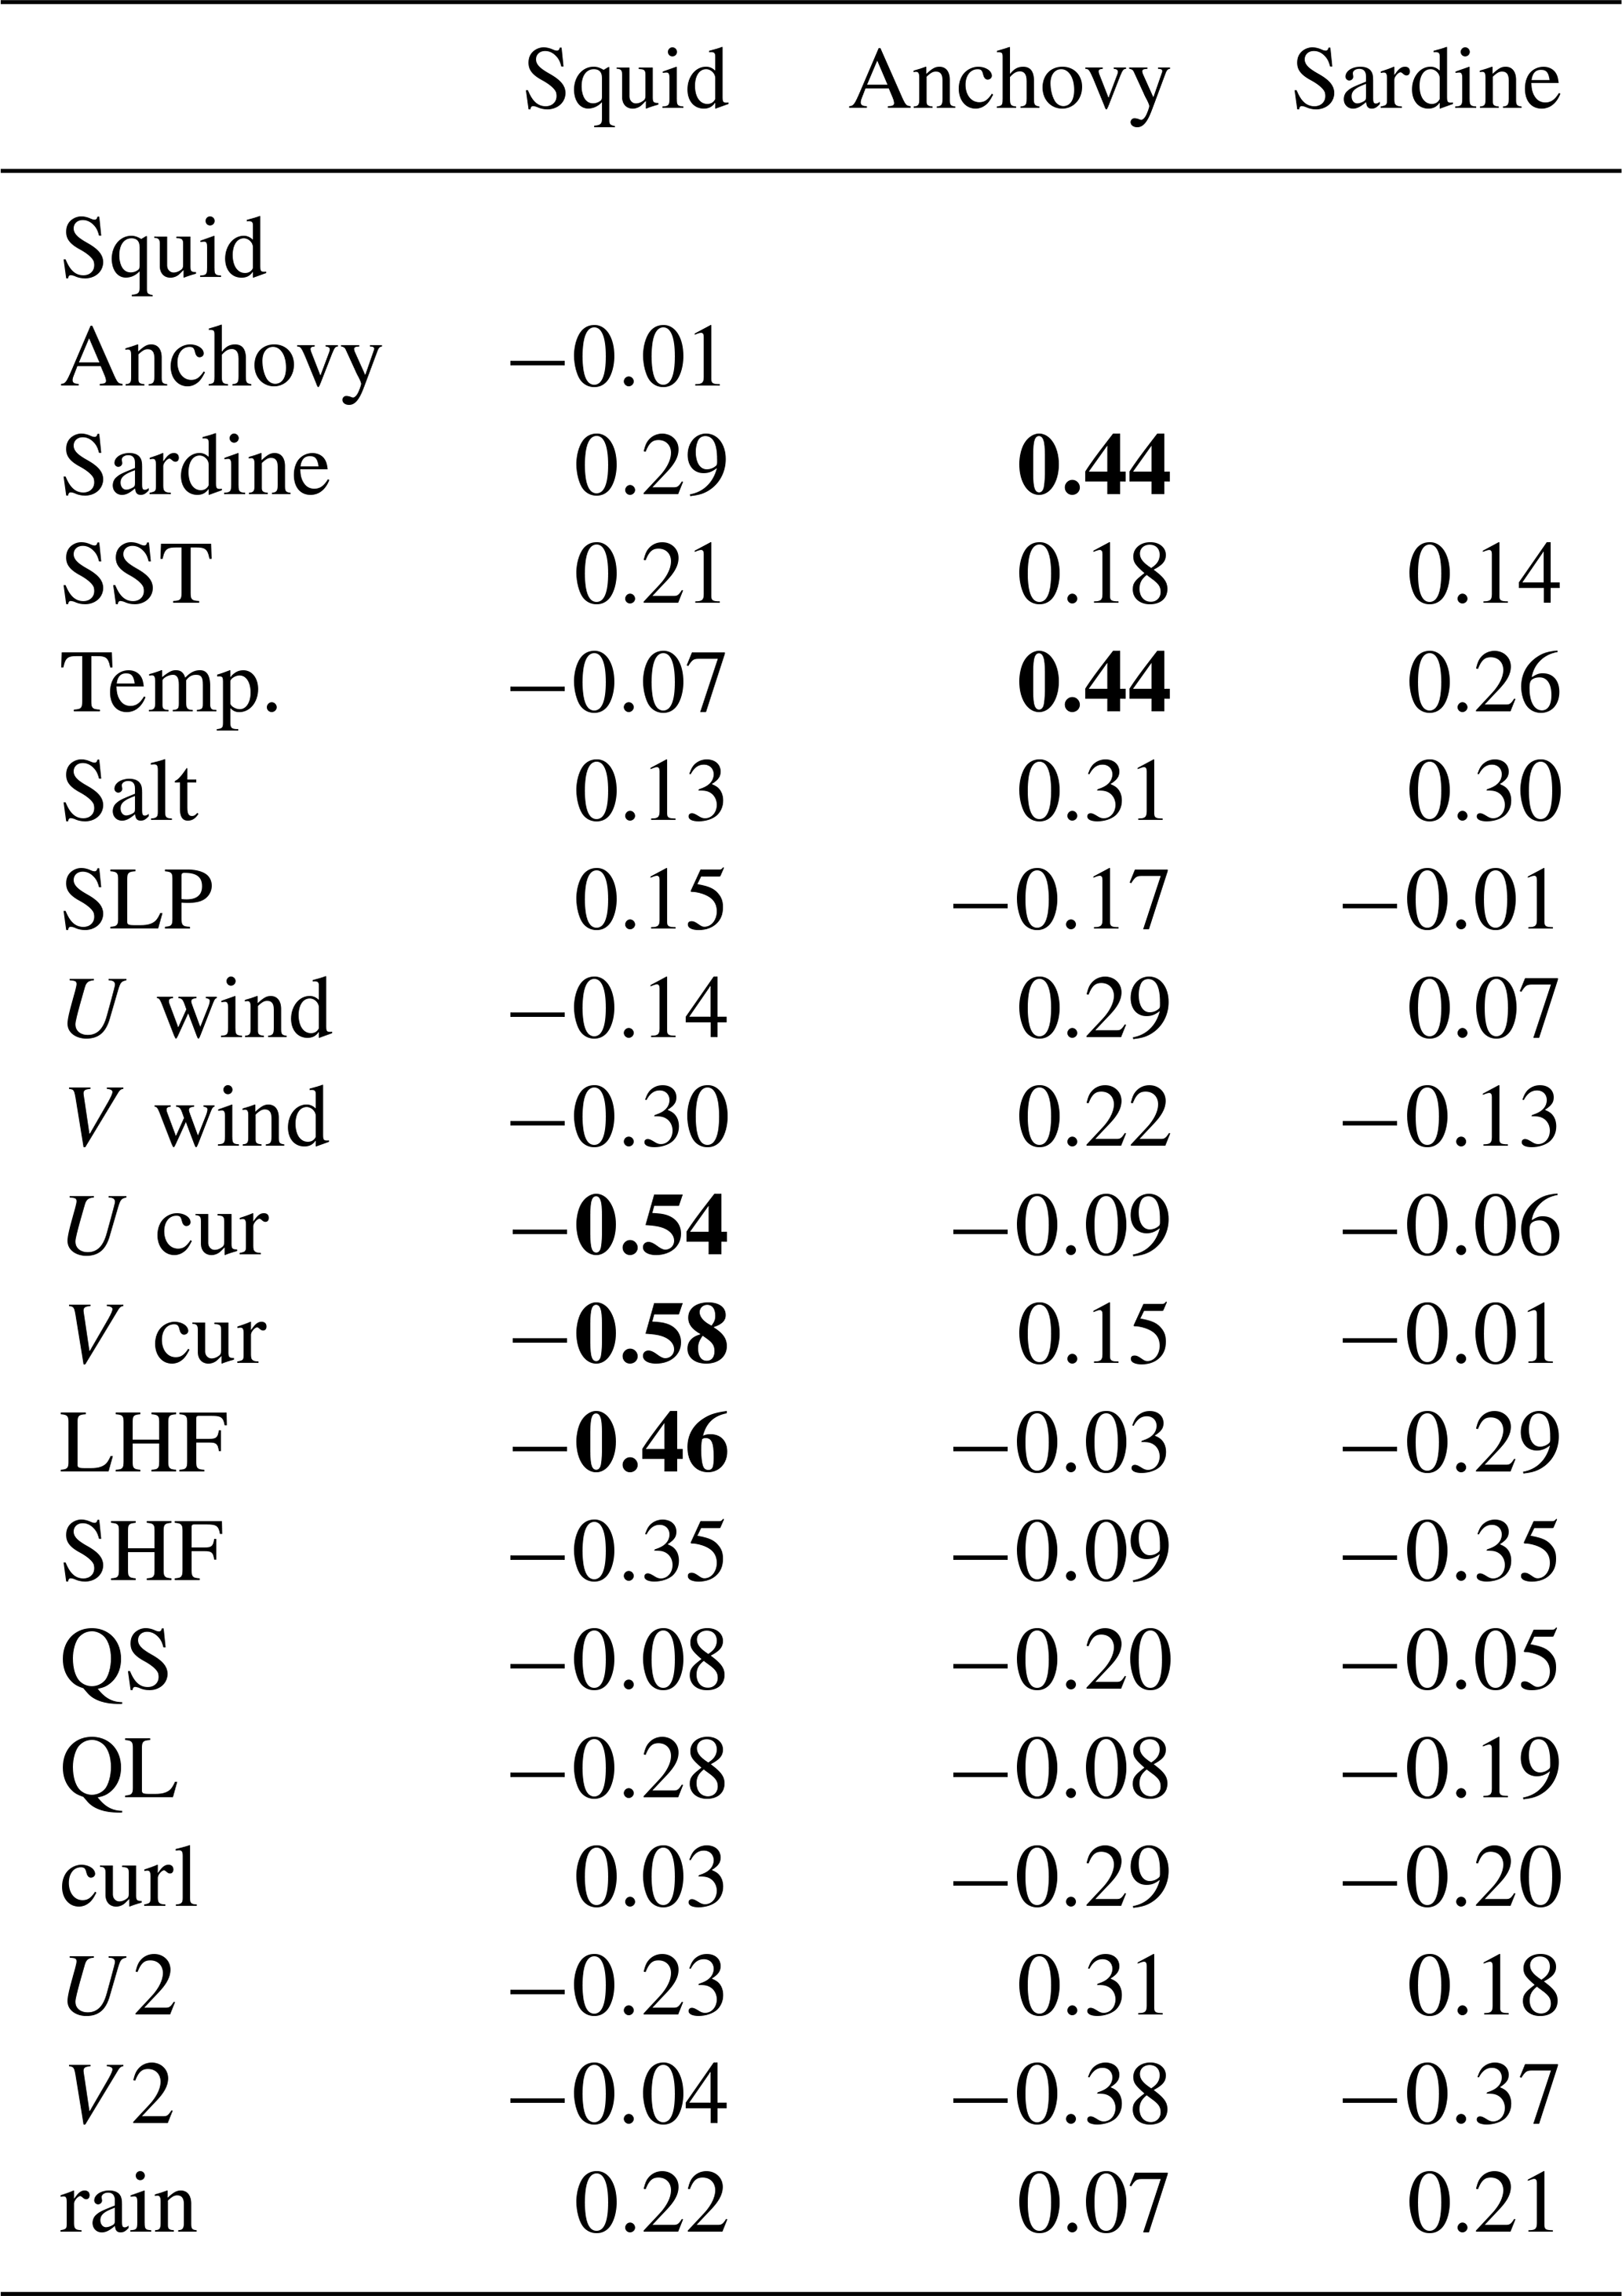
Annual fish catch data (Fig. 8) provide a basis to evaluate environmental influences, as listed in Table 2. Year-to-year changes in squid, anchovy, and sardine catches displayed weak relationships with many marine variables. Only the squid catch exhibited interannual variability; the anchovy catch was minuscule and the sardine catch showed decadal oscillations. Negative (southwestward) currents and diminished heat fluxes favored the squid catch. This may relate to the squid spawning areas being located upstream from Cape St. Francis (near Port Alfred; Roberts, 2005) during springtime (September–December; Zantsi, 2012). Thus conditions during spring off Cape Padrone influence the squid catch the following year further west. Anchovy and sardine catches increased following a season with anomalous upper northerly wind (V2, ), consistent with the large-scale summertime weather patterns in Fig. 6c that underpin increased productivity (see Jury, 2011, Fig. 5 therein).
The relative role of local and remote atmosphere and ocean forcing on marine productivity over the shelf near Cape St. Francis has been explored for the first time, using fine-scale ocean reanalysis products. The 8 d MODIS chlorophyll fluorescence and HYCOM salinity in the period 2006–2017 were the primary descriptors in an index area outlined by 34.5–33.75∘ S and 24–26.5∘ E. A variety of atmospheric and oceanic variables were obtained from high-resolution reanalysis products such as HYCOM, and statistical relationships and case studies were explored.
It was recognized that ocean color, as a proxy for marine productivity, has uncertainties due to potential contamination by clouds and aerosols, and by coastal wave- and river-induced sediments. This uncertainty was addressed by the addition of red-band fluorescence line height to the traditional green-band chlorophyll concentration. Over the annual cycle, salinity and ocean currents exhibited significant negative relationships with chlorophyll fluorescence. Furthermore, it was also recognized that the ocean reanalyses are based on coupled data assimilations that benefit from satellite technology but limited in situ calibration. Although the work infers that the ocean reanalysis is equivalent to reality, there is uncertainty that limits confidence in the interpretations. This does not prevent explorational studies as reported here but may inhibit translating outcomes into strategic decisions.
The mean pattern of chlorophyll fluorescence revealed an axis of high values off Cape Padrone, where current-edge upwelling is prevalent (Swart and Largier, 1987; Lutjeharms et al., 2000; Lutjeharms, 2006, pp. 140–146). Downstream widening of the shelf bathymetry elongates this cold tongue toward the wind-driven upwelling plumes off Cape Recife and Cape St. Francis. This shelf-edge feature modulates the location of stable layers and primary production. From October to March, a strong vertical temperature gradient tends to concentrate phytoplankton at depths > 30 m (Probyn et al., 1994) at the bottom of the euphotic zone and wind mixed layer.
The annual cycle analysis presented here revealed that marine productivity peaked in early and late summer when subtropical cutoff lows were most frequent (Favre et al., 2013). Upwelling accompanied by low salinity enhanced chlorophyll fluorescence. However, it is understood that fast rates of upwelling do not necessarily translate into a greater abundance of phytoplankton or fish. If the easterly winds are too strong, then the water column becomes mixed, advection prevails, and productivity may decline (Kämpf and Chapman, 2016). This is borne out here by covariance with salinity (see Table 1) and the fact that peak chlorophyll concentrations occur in spring and autumn, not summer (see Fig. 1d).
The large-scale point-to-field analysis indicated that a midlatitude high-pressure ridge underpins marine productivity, reducing salinity via upstream rainfall or coastal runoff and promoting wind-driven coastal upwelling and cross-shelf SSH gradients that accelerate shelf-edge currents and upwelling. Case studies and the top-10 composite revealed similar features in chlorophyll fluorescence events: they follow a spell of sustained easterly wind-driven coastal upwelling and low salinity induced by local and upstream rainfall and river discharge. The competing influences of (i) coastal runoff of ∼100 m3 s−1, (ii) marine rainfall, (iii) air–sea interactions, (iv) inshore upwelling of ∼10 m d−1, and (v) intrusions from offshore cannot be resolved in this exploratory work and deserve further study. Yet the evidence during productivity events indicates that cyclonic shear of easterly winds and shelf-edge currents (see Figs. 5a, b, 6c, A2) play prominent roles to lift water and generate high chlorophyll fluorescence along the coast. Statistically, about half the time westerly winds oppose the currents and suppress marine productivity, mainly during winter.
Earlier findings on multiday upwelling events (Goschen et al., 2012) appear complementary to those reported here for co-varying indices of marine productivity. High chlorophyll fluorescence lags a few days behind cyclonic wind and current shear and the upstream coastal hydrology, which shares a common atmospheric driver. Environmental controls on interannual fluctuations of the commercial fishery were explored using ocean reanalysis appropriate for longer timescales (monthly SODA3). Southwestward currents and diminished heat fluxes favored the squid catch, while anchovy and sardine catches were linked with upper northerly wind and large-scale weather patterns that underpin coastal upwelling and river discharge (see Jury, 2011). Earlier work determined physiographic preferences for pelagic fish on the eastern Agulhas Bank (Armstrong et al., 1991), some of which are reflected in the results of Table 2 here. In summary, the results show that the eastward passage of a subtropical high-pressure ridge underpins marine productivity near Cape St. Francis, South Africa. Earlier work has linked this ridge with easterly winds that drive coastal upwelling. In parallel, a sea surface height gradient accelerates shelf-edge upwelling. The high-pressure ridge also brings marine rainfall and river runoff that disperse low-salinity waters over the shelf, which enhance marine productivity in the area. Wavelet spectral analysis of the chlorophyll fluorescence index (see Fig. 2d) revealed that these processes conspire over a variety of timescales. Further work will analyze the pulsing of the Agulhas Current and its affect on environmental conditions over the shelf from intraseasonal to multiyear timescales. This pioneering research has employed fine-scale ocean reanalysis products in a complex coastal upwelling zone, with expectation that such use will become more important in future.
The data are available in an Excel spreadsheet by email request.
Figure A1Case study productivity event for 24 October–8 November 2009: (a) MODIS chlorophyll (mg m−3) and HYCOM currents at 10 m depth (vector), (b) HYCOM salinity at 10 m depth and cumulative CMORPH rainfall > 50 mm (contour), (c) SST map and MERRA2 surface winds (vector). Easterly flow, inshore upwelling, and high rainfall characterize this event. Thin west–east line in (a) refers to the 34.5∘ S section for Fig. A2 below.
Figure A2(a) Variance (root mean square) of sea surface height anomalies on 34.5∘ S per 0.1∘ longitude, 2006–2017. Hovmöller plots of HYCOM daily sea surface height on 34.5∘ S over 20 d during three early summer chlorophyll fluorescence events: (b) 2009, (c) 2012, and (d) 2014. Asterisk highlights steepest SSH gradient; dashed lines highlight ∼0.2 m s−1 westward movement of anticyclonic warm rings in the offshore zone. Numbers in the right column are index-area daily zonal winds (m s−1, −U from east).
The author declares that there is no conflict of interest.
Most environmental data were sourced from websites of the International Research Institute for Climate, Climate Explorer of the Netherlands Meteorological Institute, NASA Giovanni, and the University of Hawaii, Asia-Pacific Data-Research Center. Fish catches are derived from FishBase, supplemented by South African government sources. River discharge data were obtained from the South African Dept of Water, Hydrology Services website.
This paper was edited by Piers Chapman and reviewed by two anonymous referees.
Armstrong, M. J., Chapman, P., Dudley, S. F. J., Hampton, I., and Malan, P. E.: Occurrence and population structure of pilchard, round-herring and anchovy off the east coast of southern Africa, S. Afr. J. Marine Sci., 11, 227–249, 1991.
Beckley, L. E.: Spatial and temporal variability in sea temperatures in Algoa Bay, South Africa, S. Afr. J. Sci., 84, 67–69, 1988.
Blanton, J. O., Atkinson, L. P., Pietrafesa, L. J., and Lee, T. N. The intrusion of Gulf Stream water across the continental shelf due to topographically-induced upwelling, Deep-Sea Res., 28A, 393–405, 1981.
Brink, K. H.: Wind-driven currents over the continental shelf, in: The Sea vol. 10. The global coastal ocean: processes and methods, edited by: Brink, K. H. and Robinson, A. R., New York: John Wiley & Sons., 3–20, 1998.
Carton, J. A., Chepurin, G. A., and Chen, L.: SODA3 a new ocean climate reanalysis, J. Climate, 31, 6967–6983, 2018.
Chassignet, E. P., Hurlburt, H. E., Metzger, E. J., Smedstad, O. M., Cummings, J. A., Halliwell, G. R., Bleck, R., Baraille, R., Wallcraft, A. J., Lozano, C., Tolman, H. L., Srinivasan, A., Hankin, S., Cornillon, P., Weisberg, R., Barth, A., He, R., Werner, R., and Wilkin, J.: US GODAE: Global ocean prediction with the Hybrid coordinate ocean model (Hycom), Oceanography, 22, 64–75, 2009.
Chin, T. M., Vazquez-Cuervo, J., and Armstrong, E. M.: A multi-scale high-resolution analysis of global sea surface temperature, Remote Sens. Environ., 200, 154–169, 2017.
Cochrane, K. L., Oliver, B., and Sauer, W.: An assessment of the current status of the chokka squid fishery in South Africa and an evaluation of alternative allocation strategies, Mar. Policy, 43, 149–163, 2014.
Cummings, J. A. and Smedstad, O. M.: Variational data assimilation for the global ocean, Data assimilation for atmospheric, oceanic and hydrologic applications II, Springer-Verlag, 13, 303–343, 2013.
Favre, A., Hewitson, B., Lennard, C., Cerezo-Mota, R., and Tadross, M.: Cut-off Lows in the South Africa region and their contribution to precipitation, Clim. Dynam., 41, 2331–2351, 2013.
Funk, C., Peterson, P., Landsfeld, M., Pedreros, D., Verdin, J., Shukla, S., Husak, G., Rowland, J., Harrison, L., Hoell, A., and Michaelsen, J.: The climate hazards infrared precipitation with stations: a new environmental record for monitoring extremes, Nature Sci. Data, 2, 150066, https://doi.org/10.1038/sdata.2015.66, 2015.
Gelaro, R., McCarty, W., Suárez, M. J., Todling, R., Molod, A., Takacs, L., Randles, C. A., Darmenov, A., Bosilovich, M. G., Reichle, R., Wargan, K., Coy, L., Cullather, R., Draper, C., Akella, S., Buchard, V., Conaty, A., da Silva, A. M., Gu, W., Kim, G., Koster, R., Lucchesi, R., Merkova, D., Nielsen, J. E., Partyka, G., Pawson, S., Putman, W., Rienecker, M., Schubert, S. D., Sienkiewicz, M., and Zhao, B.: The Modern-era retro-spective analysis for research and applications, version 2 (MERRA2), J. Climate, 30, 5419–5454, 2017.
Gill, A. E. and Schumann, E. H. Topographically induced changes in the structure of an inertial coastal jet: application to the Agulhas Current, J. Phys. Oceanogr., 9, 975–991, 1979.
Goschen, W. S. and Schumann, E. H.: Ocean current and temperature structures in Algoa Bay and beyond during November 1986, S. Afr. J. Marine Sci., 7, 101–116, 1988.
Goschen, W. S. and Schumann, E. H.: Agulhas Current variability and inshore structures off the Cape Province, South Africa, J. Geophys. Res., 95, 667–678, 1990.
Goschen, W. S. and Schumann, E. H.: The physical oceanographic processes of Algoa Bay, with emphasis on the western coastal region, SAEON internal publication, Pretoria, 84 pp., 2011.
Goschen, W. S., Schumann, E. H., Bernard, K. S., Bailey, S. E., and Deyzel, S. H. P.: Upwelling and ocean structures off Algoa Bay and the south-east coast of South Africa, Afr. J. Mar. Sci., 34, 525–536, 2012.
Goschen, W. S., Bornman, T. G., Deyzel, S. H. P., and Schumann, E. H.: Coastal upwelling on the far eastern Agulhas Bank associated with large meanders in the Agulhas Current, Cont. Shelf Res., 101, 34–46, 2015.
Gower, J.: On the use of satellite-measured chlorophyll fluorescence for monitoring coastal waters, Int. J. Remote Sens., 37, 2077–2086, 2016.
Houskeeper, H. F. and Kudela, R. M.: Behind the masks in coastal ocean color, Ocean Optics Conference, available at: https://www.oceanopticsconference.org/extended/Houskeeper_Henry.pdf, last access: 29 November 2017.
Hsueh, Y. and O'Brien J. J.: Steady coastal upwelling induced by an along-shore current, J. Phys. Oceanogr., 1, 180–186, 1971.
Hu, C., Lee, Z., and Franz, B.: Chlorophyll-a algorithms for oligotrophic oceans: A novel approach based on three-band reflectance difference, J. Geophys. Res., 117, C01011, https://doi.org/10.1029/2011jc007395, 2012.
Hutchings, L.: The Agulhas Bank: a synthesis of available information and a brief conmparison with othe east-coast shelf regions, S. Afr. J. Sci., 90, 179–185, 1994.
Joyce, R. J., Janowiak, J. E., Arkin, P. A., and Xie, P. P.: CMORPH: A method that produces global precipitation estimates from passive microwave and infrared data at high spatial and temporal resolution, J. Hydrometeorol., 5, 487–503, 2004.
Jury, M. R.: Environmental influences on South African fish catch: South coast transition, Intl. J. Oceanogr., 920414, https://doi.org/10.1155/2011/920414, 2011.
Jury, M. R.: Meteorological controls on big waves south of Africa, Reg. Studies Marine Science, 27, 100538, doi.org/10.1016/j.rsma.2019.100538. 2019.
Jury, M. R. and Goschen, W.: Inter-relationships between physical ocean-atmosphere variables over the shelf south of South Africa from reanalysis products, Cont. Shelf Res., in review, 2019.
Jury, M. R., MacArthur, C., and Reason, C.: Observations of trapped waves in the atmosphere and ocean along the coast of southern Africa, S. Afr. Geogr. J., 72, 33–46, 1990.
Kämpf, J. and P. Chapman, P.: Upwelling Systems of the World, Springer, 433 pp., 2016.
Liu, Z. and Gan, J.: Upwelling induced by the frictional stress curl and vertical squeezing of the vortex tube over a submerged valley in the East China Sea, J. Geophys Res.-Oceans, 120, 2571–2587, 2015.
Lutjeharms, J. R. E.: The Agulhas Current, Berlin, Springer, 329 pp., 2006.
Lutjeharms, J. R. E. and Roberts, H. R.: The Natal Pulse: an extreme transient on the Agulhas Current, J. Geophys. Res., 93, 631–645, 1988.
Lutjeharms, J. R. E., Catzel, R., and Valentine, H. R.: Eddies and other boundary phenomena of the Agulhas Current, Cont. Shelf Res., 9, 597–616, 1989.
Lutjeharms, J. R. E., Cooper, J., and Roberts, M. J.: Upwelling at the inshore edge of the Agulhas Current, Cont. Shelf Res., 20, 737–761, 2000.
Malan, N., Backeberg, B., Biastoch, A., Durgadoo, J.V., Samuelsen, A., Reason, C., and Hermes, J.: Agulhas Current Meanders facilitate shelf-slope exchange on the Eastern Agulhas Bank, J. Geophys. Res.-Oceans, 123, 4762–4778, 2018.
Pattrick, P., Strydom, N. A., and Goschen, W. S.: Shallow-water, nearshore current dynamics in Algoa Bay, South Africa, with notes on the implications for larval fish dispersal, Afr. J. Mar. Sci., 35, 269–282, 2013.
Probyn, T. A., Mitchell-Innes, B. A., Brown, P. C., Hutchings, L., and Carter, R. A.: A review of primary production and related processes on the Agulhas Bank, S. Afr. J. Sci., 90, 166–173, 1994.
Reichle, R. H., Draper, C. S., Liu, Q., Girotto, M., Mahanama, S. P., Koster, R. D., and DeLannoy, G. J.: Assessment of MERRA-2 land surface hydrology estimates, J. Climate, 30, 2937–2960, 2017.
Roberts, M. J.: Chokka squid (Loligo vulgaris reynaudii) abundance linked to changes in South Africa's Agulhas bank ecosystem during spawning and the early life cycle, ICES J. Mar. Sci., 62, 33–55, 2005.
Roberts, M. J.: Coastal currents and temperatures along the eastern region of Algoa Bay, South Africa, with implications for transport and shelf-bay water exchange, Afr. J. Mar. Sci., 32, 145–161, 2010.
Roberts, M. J., Downey, N. J., and Sauer, W. H.: The relative importance of shallow and deep shelf spawning habitats for the South African chokka squid, ICES J. Marine Science, 69, 563–571, 2012.
Roualt, M. and Lutjeharms, J. R. R.: Estimation of sea-surface temperature around southern Africa from satellite-derived microwave observations, S. Afr. J. Sci., 99, 489–494, 2003.
Rouault, M. J. and Penven, P.: New perspectives on Natal Pulses from satellite observations, J. Geophys. Res., 116, 1–14, 2011.
Scharler, U. M. and Baird, D.: The filtering capacity of selected Eastern Cape estuaries, South Africa, Water S.A., 31, 483–490, 2005.
Schumann, E. H.: The bottom boundary layer inshore of the Agulhas Current off Natal in August 1975, S. Afr. J. Marine Sci., 4, 93–102, 1986.
Schumann, E. H.: The coastal ocean off the east coast of South Africa, T. Roy. Soc. S. Afr., 46, 215–228, 1987.
Schumann, E. H.: Wind-driven mixed layer and coastal upwelling processes off the south coast of South Africa, J. Mar. Res., 57, 671–691, 1999.
Schumann, E. H. and Beekman, L. J.: Ocean temperature structures on the Agulhas Bank, T. Roy. Soc. S. Afr., 45, 191–203, 1984.
Schumann, E. H. and Brink, K. H.: Coastal trapped waves off the coast of South Africa: generation, propagation and current structures, J. Phys. Oceanogr., 20, 1206–1218, 1990.
Schumann, E. H. and Martin, J. A.: Climatological aspects of the coastal wind field at Cape Town, Port Elizxabeth and Durban, S. Afr. Geogr. J., 73, 48–51, 1991.
Schumann, E. H., Perrind, L. A., and Hunter, I. T.: Upwelling along the south coast of the Cape Province, South Africa, S. Afr. J. Sci., 78, 238–242, 1982.
Schumann, E. H., Churchhill, J. R. S., and Zaayman, H. J.: Oceanic variability in the western sector of Algoa Bay, South Africa, Afr. J. Mar. Sci., 27, 65–80, 2005.
Shannon, L. V., Hutchings, L., Bailey, G. W., and Shelton, P. A.: Spatial and temporal distribution of chlorophyll in southern African waters as deduced from ship and satellite measurements and their implications for pelagic fisheries, S. Afr. J. Mar. Sci., 2, 109–130, 1984.
Swart, V. P. and Largier, J. L.: Thermal structure of Agulhas Bank water, in: The Benguela and comparable ecosystems, edited by: Payne, A. I. L., Gulland, J. A., and Brink, K. H., S. Afr. J. Marine Sci., 5, 243–253, 1987.
Tolman, H. L.: User manual and system documentation of WAVEWATCH-III, NCEP Technical Note, Washington, 139 pp., 2002.
van Bladeren, D., Zawada, P. K., and Mahlangu, D.: Statistical based regional flood frequency estimation study for South Africa using systematic, historical and palaeo-flood data, Water Research Commission W.R.C. Report 1260/1/70, 2007.
van Zyl, B. and Willemse, N. E.: FishBase: a database and fisheries management-oriented tool for the 21st century, African J. Aquat. Sci., 25, 225–226, 2000.
Zantsi, B.: The chokka squid fishery in South Africa: Review of the 2005 policy, United Nations University Fisheries Training programme, final project, 38 pp., available at: https://www.unuftp.is/static/fellows/document/bongiwe12prf.pdf (last access: 30 October 2019), 2012.