the Creative Commons Attribution 4.0 License.
the Creative Commons Attribution 4.0 License.
 | 26 Mar 2019
Characterization of bottom sediment resuspension events observed in a micro-tidal bay
Pablo Cerralbo
Jorge Guillén
Manuel Espino
Lars Boye Hansen
Agustín Sánchez-Arcilla
In this study we investigate the variability in near-bottom turbidity in Alfacs Bay (in the northwestern Mediterranean Sea). The bay is characterized by a micro-tidal environment and seiching activity that may lead to flow velocities of more than 50 cm s−1. A set of current meters and optical sensors were mounted near the sea bottom to acquire synchronous hydrodynamic and optical information from the water column. The time-series observations showed an evident relation between seiche activity and sediment resuspension events. The observations of turbidity peaks are consistent with the node–antinode location of the fundamental and first resonance periods of the bay. The implementation of a coupled wave–current numerical model shows strong spatial variability of the potential resuspension locations. Strong wind events are also a mechanism responsible for the resuspension of fine sediment within the bay. This is confirmed by suspended sediment concentration maps derived from Sentinel-2 satellite imagery. We suggest that the sequence of resuspension events plays an important role in the suspended sediment concentration, meaning that the occurrence of sediment resuspension events may increase the suspended sediment in subsequent events. The suspended sediment events likely affect the ecological status of the bay and the sedimentary process over a long-term period.


Suspended sediment in the water column and subsequent deposition play a critical role in coastal ecosystems and the management of coastal environments. High levels of suspended sediment in the water column have substantial implications for aquatic ecosystems and natural habitats (Ellis et al., 2002), particularly over longer exposure periods (Newcombe and Macdonald, 1991). Furthermore, sediment supplied from rivers potentially transports significant amounts of organic matter, pollutants, and heavy metals that may be deposited on the seabed or even transported offshore (Palanques et al., 2017). The sediment dynamics are relevant in coastal bays and estuaries due to the large amount of sediment delivered by freshwater and the presence of potential fine-sediment trapping zones in these areas. In addition, sediment resuspension significantly contributes to the total nutrient load (Sondergaard et al., 1992) and prevents sunlight penetration (Mehta, 1989). The analysis and prevention of fine sediment within basins and channels also plays an important role in port engineering and is used to examine and monitor siltation processes (e.g. Ghosh et al., 2001; van Maren et al., 2015). Finally, the growth of harmful species, such as dinoflagellate cysts, may be related to significant local resuspension via the mixing of the upper layers, resulting in more homogenous cyst profiles in the sediment (Giannakourou et al., 2005).
In coastal areas, sediment transport is related to the hydrodynamic conditions. On long timescales, advection processes determine the final depositional pattern as a function of the sediment and water current variables (Ogston et al., 2000; Bever et al., 2009). Hydrodynamic processes driven by wind waves (Grifoll et al., 2013; Carlin et al., 2016), tides (Fan et al., 2004; Garel et al., 2009), winds (Sherwood et al., 1994; Hofmann et al., 2011), surface seiches (Jordi et al., 2008), or internal seiches (Shteinman et al., 1997) promote the resuspension, advection, and settling of fine sediment, conditioned by the continental sediment sources. Subsequent resuspension effects due to natural causes also contribute to the reworking and final deposition of the sediment load (Guillén et al., 2006; Grifoll et al., 2014a). Moreover, anthropogenic activities such as trawling, ship propellers, and waves generated by vessels, introduce additional energy into the water system and influence the resuspension, transport, and final sediment deposition, in particular in shallow waters (e.g. Garel et al., 2009; Hofmann et al., 2011).
This study focuses on Alfacs Bay (in the northwestern Mediterranean Sea – in the southern region of the Ebro Delta) which is a micro-tidal estuary. The bay area is intensively exploited by commercial activities, including tourism, fishing, and aquaculture; hence, the ecosystem has a significant economic importance. In the past, the bay has been extensively investigated in terms of its hydrodynamic response (Solé et al., 2009; Llebot et al., 2014; Cerralbo et al., 2015a, 2016, 2018), tidal wave propagation (Cerralbo et al., 2014), biochemical processes (Llebot et al., 2010, 2011), and optical water properties (Ramírez-Pérez et al., 2017). The estuary mainly receives freshwater discharge from the rice fields on the Ebro River. Several episodes of algal blooms have been reported and have been linked to increased nutrient concentrations, which were possibly triggered by resuspension mechanisms. Moreover, the presence of harmful bacteria has been found in bivalves in the region which has negative effects on aquaculture (Loureiro et al., 2009; Roque et al., 2009).
The goal of this study was to improve the knowledge regarding fine-sediment dynamics in coastal bays and provide insight into the controlling factors of sediment resuspension events observed within the Alfacs micro-tidal bay. Using sea-level heights, water currents, and wind speed measurements we investigated the driving mechanisms of the resuspension of fine bottom sediment within the bay. Subsequently, the spatial and temporal interpretation of the resuspension mechanisms were linked to hydrodynamic processes and analysed via the implementation of a coupled wave–current numerical model. This contribution aims to explain resuspension mechanisms which may have a positive impact with respect to management activities (e.g. harmful species resuspension or algal blooms with negative effects on aquaculture activities).
The water circulation in Alfacs Bay has been extensively analysed in previous studies, using observational data sets and numerical models (Camp and Delgado, 1987; Cerralbo et al., 2014, 2015a; Llebot et al., 2014). However, fine-sediment dynamics and their resuspension mechanisms have not been examined to date. Synchronous optical measurements, in combination with velocity and sea-level measurements, have facilitated an opportunity to investigate the resuspension mechanisms in this region. Considering that Alfacs Bay is a micro-tidal estuary, wind or wind waves are candidate mechanisms for the dispersal of fine sediment.
2.1 Study area
Alfacs Bay, located in the south of the Ebro Delta, is formed by the prograding southern spit. The semi-enclosed bay is approximately 16 km long and 4 km wide. The average depth is 4 m and the maximum depth is about 6.5 m in the middle of the bay (Fig. 1). A central channel, which is 2.5 km long and 6.5 m deep, connects the bay with the open ocean. Shallow edges that are around 1–2 m deep are found on both sides of the bay. To the north, the bay is surrounded by rice fields. From April to December, these fields spill around 10 m3 s−1 of freshwater that is loaded with nutrients into the bay. These nutrient rich waters are distributed among several channels on the eastern side of the delta, close to a sandy beach. The seabed in the central part of the bay is composed of very fine sediments (typically 50 %–65 % silt, 30 %–45 % clay, and approximately 5 % sand) with an increasingly sandy content towards the edges of the bay (Guillén and Palanques, 1997; Satta et al., 2013). The bottom of Alfacs Bay is composed of mud, with a significant clay and sand content (Palacín et al., 1991). It was discovered that the muddy sediment extends to the central part of the bay, whereas the sand content increases near the spit that separates the bay from the open ocean. The same was found along the southern shallow edge.
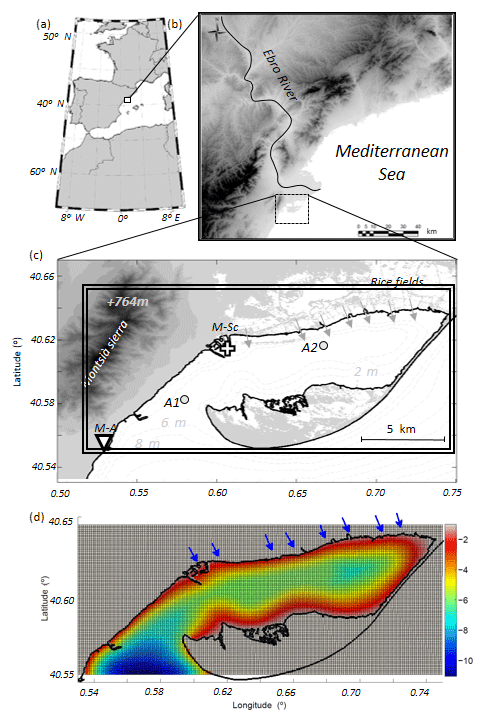
Figure 1(a) The location of the Ebro River delta in a regional context. (b) The location of Alfacs Bay in the Ebro River delta. (c) An overview map of the Alfacs Bay. The location of the meteorological station is marked with a triangle (M-A) and a white cross marks the location of the Sant Carles de la Ràpita tide gauge (M-Sc). The Grey circles show the ADCP and OBS mooring locations A1 and A2, respectively. The gray arrows along the northern coast depict the freshwater drainage points considered in the simulation. Panel (d) shows the modelling domain, with the background grid corresponding to the numerical mesh used in the numerical model. The blue arrows along the northern coast show the freshwater drainage points considered in the simulation. The colour bar indicates depth in metres.
The bay is categorized as a salt-wedge estuary (Camp and Delgado, 1987) and has almost stable stratification all year. Tidal ranges during spring tides reach around 0.2 m, and the hydrodynamic fluctuations are controlled by the wind and modulated by the seiche activity during short periods (Cerralbo et al., 2015a). Both wind and salinity gradients due to freshwater discharge dominate the water circulation in the low-frequency band (Solé et al., 2009; Cerralbo et al., 2018). Intense regional winds from the north and northwest and orographic effects result in wind jets in the Ebro River valley (Grifoll et al., 2015, 2016). This offshore wind is characterized by noticeable spatial variability due to the surrounding topography (Cerralbo et al., 2015b). The water column within the bay is usually stratified due to the freshwater discharge, but well-mixed conditions are common during winter as a consequence of the hydrodynamic response to strong wind forcing (Llebot et al., 2014) and occasionally due to seiches (Cerralbo et al., 2015a). During the summer, the contribution of the temperature to stratification may also be substantial (Cerralbo et al., 2015a).
2.2 Measurement campaigns
The bulk of the observational data were collected during a 2-month field campaign from July to mid-September 2013. Water currents were measured using two 2 MHz acoustic Doppler current profilers (ADCPs) that were moored in the mouth (Fig. 1 – A1) and inner bay (Fig. 1 – A2); these instruments were configured to record 10 min averaged data from 10 registers per minute with 25 cm vertical cells. Both devices were equipped with an optical backscatter sensor (Campbell Scientific OBS-3), a bottom pressure meter, and a temperature sensor. The instruments were mounted at the sea bottom at a depth of 6.5 m, whereas the sensors were 0.25 m above the seabed. The signals from the OBS instruments were transformed into nephelometric turbidity units (NTU) according to the device calibration report. In the past, a linear relation between the optical signal and the suspended sediment concentration has been observed in the study area (Guillén et al., 2000). The ADCP has a 20 cm blanking zone. Additional sea-level data were obtained using a sea-level gauge mounted in Sant Carles de la Ràpita harbour (Fig. 1) and bottom pressure systems from the ADCPs. Atmospheric data (wind, atmospheric pressure, solar radiation, and humidity) were obtained from a land-based station (M-Sc) located in Sant Carles de la Ràpita, which was mounted 10 m above the ground.
2.3 Current and wave model implementation
We use the coupled SWAN-ROMS models included in the COAWST system in order to simulate the hydrodynamics within the bay. The COAWST system (Warner et al., 2010) consists of several state-of-the-art numerical models such as ROMS (Regional Ocean Modeling System) for ocean and coastal circulation and SWAN (Simulating Waves Nearshore) for surface wind-wave simulation. SWAN is a third-generation numerical wave model that computes random, short-crested waves in coastal regions with shallow water and ambient currents (Booij et al., 1999). It is based on the wave action balance with sources and sinks and incorporates state-of-the-art formulations of the processes of wave generation, dissipation, and wave–wave interactions. ROMS is a three-dimensional circulation model which solves the primitive variables on a σ-level in the vertical and horizontal regular grid. Numerical aspects of ROMS are described in detail in Shchepetkin and McWilliams (2005). In the COAWST system, the wave model provides hydrodynamic parameters (i.e. significant wave height, average wave periods, wave propagation direction, near-bottom orbital velocity, and wave energy dissipation rate) to the water circulation model. The ocean model provides water depth, sea surface elevation, and current velocity to the wave model. The variables exchange is made “online” during the simulation processes, via the Model Coupling Toolkit (Jacob et al., 2005), where a multi-processes message passing interface (MPI) protocol is used to distribute the computations among several nodes. The COAWST system also includes different formulations to parameterize the wave–current bottom boundary layer and the wave effect on currents (Warner et al., 2008; Kumar et al., 2012).
The implementation of the COAWST system in Alfacs Bay consists of a regular grid of 186×101 points with a spatial resolution of 100 m (in both the eastward and northward grid directions) and 12σ levels in the vertical direction. Details regarding the implementation and the skill assessment of the ROMS model in Alfacs Bay are provided by Cerralbo et al. (2015a). The same regular grid is used by the SWAN model. A 2-year water circulation simulation (2012–2013) was performed in order to obtain realistic three-dimensional temperature and salinity fields. The barotropic time step for ROMS is set to 30 s, and in SWAN the wave field is solved at a time interval of 3600 s. The interval time between the exchange of variables for ROMS and SWAN was established in 3600 s. For both simulations, water motion at the open boundary was forced by depth-averaged velocities and sea-level measurements at A1 (data interval of 600 s). The freshwater inputs are distributed on eight points and simulate the main rice channels with a total discharge of 10 m3 s−1 (Cerralbo et al., 2015a).
The bottom boundary layer was parameterized using the combined wave–current (Styles and Glenn, 2000) that was adopted in ROMS and SWAN coupling (Warner et al., 2008). The input parameters for the model are the velocity components and wave characteristics near the bottom (wave period, wave direction, and wave orbital direction). For each computational step, an initial assessment of bed roughness length is estimated as a function of the grain size, ripples, and sediment transport. Consequently, the pure current bottom stress (τc) and pure wave bottom stress (τw) are computed as follows:
where z is the vertical coordinate, z0 is the total bottom roughness length, u and v are the water current components, ub is the orbital velocity, κ is the von Kármán constant, and fw is the Madsen wave-friction factor. The maximum bottom stress under wave–current conditions is computed as (Soulsby, 1997)
The wave effects from currents are considered using vortex-force formalism, which is included in COAWST. This approach considers the effect from gravity waves on the mean flow, and was tested in different experimental and real configurations by Kumar et al. (2012).
3.1 Observations
In order to investigate the suspended sediment events within Alfacs Bay, we used a subset of the total observations recorded at A2: from 2 to 8 August 2013. This is because the subset data selected include the main hydrodynamic conditions likely to increase the near-bottom turbidity. Figure 2 shows the time series recorded at A2 in terms of NTU from the OBS, measured sea-level height (the sea-level height measured at A1 is also shown), bottom current speed in m s−1 at A1, and wind speed and direction measured at M-Sc (see Fig. 1). The sea-level height reference was obtained by subtracting the mean value of the pressure meter time series provided by the ADCP.

Figure 2Time series of the variables measured during the field campaign. (a) Wind speed measured at M-Sc. (b) Wind direction measured at M-Sc. (c) Sea-level height measured at A2 (blue) and A1 (red). (d) Near-bottom current speed measured at A1. (e) NTU measured by OBS mounted at the A2 station. Vertical bars show the episodes considered in the analysis.
Two typical wind conditions are considered (Fig. 2a, b): sea breeze and the northwesterly winds (Cerralbo et al., 2015a). The sea breeze is associated with an increase in wind speed during the central hours of the day (approximately from 11:00 to 18:00 GMT with a wind direction within the range of approximately 30 to 180∘). From a daily point of view, this seems evident during the 1 to 6 August period. A different pattern is observed during the wind speed peak (7 to 8 August) when 330∘ wind directions were measured. This corresponds to an offshore wind typical for the region (northwesterly winds known as “mistral” winds).
During the analysis period (on 3 August), a seiche event was also captured. This seiche event was previously described (hydrodynamically) in Cerralbo et al. (2015a) revealing an oscillation (of 1 h periods) in sea level and currents. This oscillation is characterized by a node (roughly located at A2) where the velocities reach a maximum, and an antinode (approximately located at A1) where the amplitude of the sea-level oscillation reaches a maximum (see sea-level height at A1 in comparison to A2 in Fig. 2c). The homogeneous vertical profile in velocities measured at A2 is shown in Fig. 3, with velocity peaks in the order of 0.5 m s−1 in the water column, in the along-shore direction (i.e. following the axis of the bay). The near-bottom water current speeds at A2 (Fig. 2d) show fluctuations with peaks over 0.1 m s−1, except for the previously mentioned seiche event during which peaks rose to 0.4 m s−1.
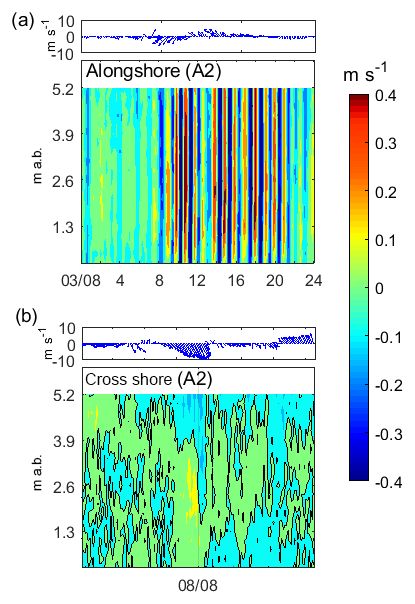
Figure 3Each panel shows (at the top) the wind speed measured at M-Sc in m s−1. At the bottom the vertical profiles show the speed measured at A2 (in m s−1; mab stands for metres above the bottom). Black lines show the zero speed isolines. Different events are shown in each panel: (a) for the along-shore direction on 3 August 2013, and (b) for the cross-shore direction on 8 August 2013.
The near-bottom turbidity shows a fluctuating behaviour with values ranging from almost 0 to over 10 NTU (Fig. 2e). Three distinct events with high turbidity are observed. These events are E1 (covering the period from 08:00 GMT on 3 August to 10:00 GMT on 5 August), E2 (from 03:00 to 12:00 GMT on 6 August), and E3 (from 08:00 GMT on 7 August to 15:00 GMT on 8 August). The maximum turbidity is measured during the E1 event (maximum turbidity of 41.1 NTU). This event also lasts longer than the E2 (maximum turbidity of 4.6 NTU) and E3 (maximum turbidity of 12.1 NTU) events.
3.2 Skill assessment near the sea bottom
The performance of the water circulation model used in this study was examined in terms of sea level, water currents, and temperature/salinity evolution in previous research (Cerralbo et al., 2014). However, in this work we pay attention to the near-bottom velocities due to their relevant role in the sediment resuspension and transport dynamics. Thus, the skill assessment of the near-bottom velocities at A1 and A2 is analysed using a Taylor diagram (Taylor, 2001). This diagram characterizes the similarity between numerical model and observations using their correlation, the root mean square difference (RMSD), and the amplitude of their variations (represented by their standard deviations). The skill of the model improves when the triangles are closer to the observation reference point in the diagram which denotes full agreement between the model and the observations (Fig. 4). In general, the model results showed good agreement with the observations in the prevalent along-shelf direction, with correlations larger than 0.5 and RMSD values below 1. In addition, the water current fluctuations are well represented in the model because the normalized standard deviation is close to 1 at both measuring points.
3.3 Modelled bottom stress
The bottom stress is obtained from the coupled numerical model implemented in Alfacs Bay. Figures 5 and 6 show different snapshots of the modelling results to examine the bottom stress pattern for two components (i.e. wave-induced and current-induced bottom stress). These results correspond to the different episodes identified from the previous observational analysis. The plot scale of the bottom stress is transformed in log 10 for clarity. During the E1 case (3 August 2013, 10:00 GMT) the bottom stress is mainly caused by currents (Fig. 5a, c, e). Maximum values of 0.15 Pa for the combined bottom stress are obtained in the centre of the bay, and at the mouth. This episode corresponds to a seiche event, and the spatial variability of the bottom stress is consistent with the spatial pattern of the node–antinode position. This means that the maximum combined bottom stress (associated with maximum water currents) corresponds to the node position (minimum sea-level amplitude). In contrast, the minimum bottom stress corresponds to the antinode position (maximum sea-level amplitude). The A2 position is located near the node, where the water currents are at their maximum during the seiche event (0.08 Pa for combined bottom stress). It is worth mentioning the node–antinode pattern of the current-induced bottom stress, which would presumably indicate a large spatial variability of the resuspension process within the bay.
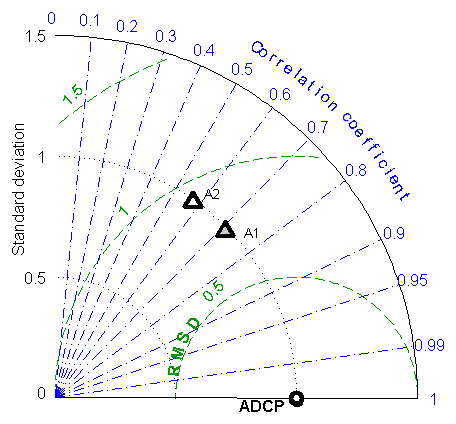
Figure 4Taylor diagram comparing the error metrics between the observations and model results for the near-bottom currents. A1 and A2 correspond to the ADCP locations shown in Fig. 1.
After the seiche activity (second stage of E1), the wind speed increases due to the sea breeze and the current-induced bottom stress (5 August 2013, 08:00 GMT) decreases significantly, particularly in the centre of the bay (Fig. 5b, d, f). The bottom stress distribution shows how the maximum values are obtained near the shoreline (2.2 Pa) due to the contribution of the wave-induced bottom stress. At A2, the combined bottom stress is equal to 0.03 Pa (which is presumably too small to induce resuspension). For this event, the wave field during the sea breeze is shown in Fig. 7; it reveals that the maximum significant wave height (equal to 0.3 m) occurs near the northern and southern shallow edges which is consistent with the maximum wave-induced bottom stress.
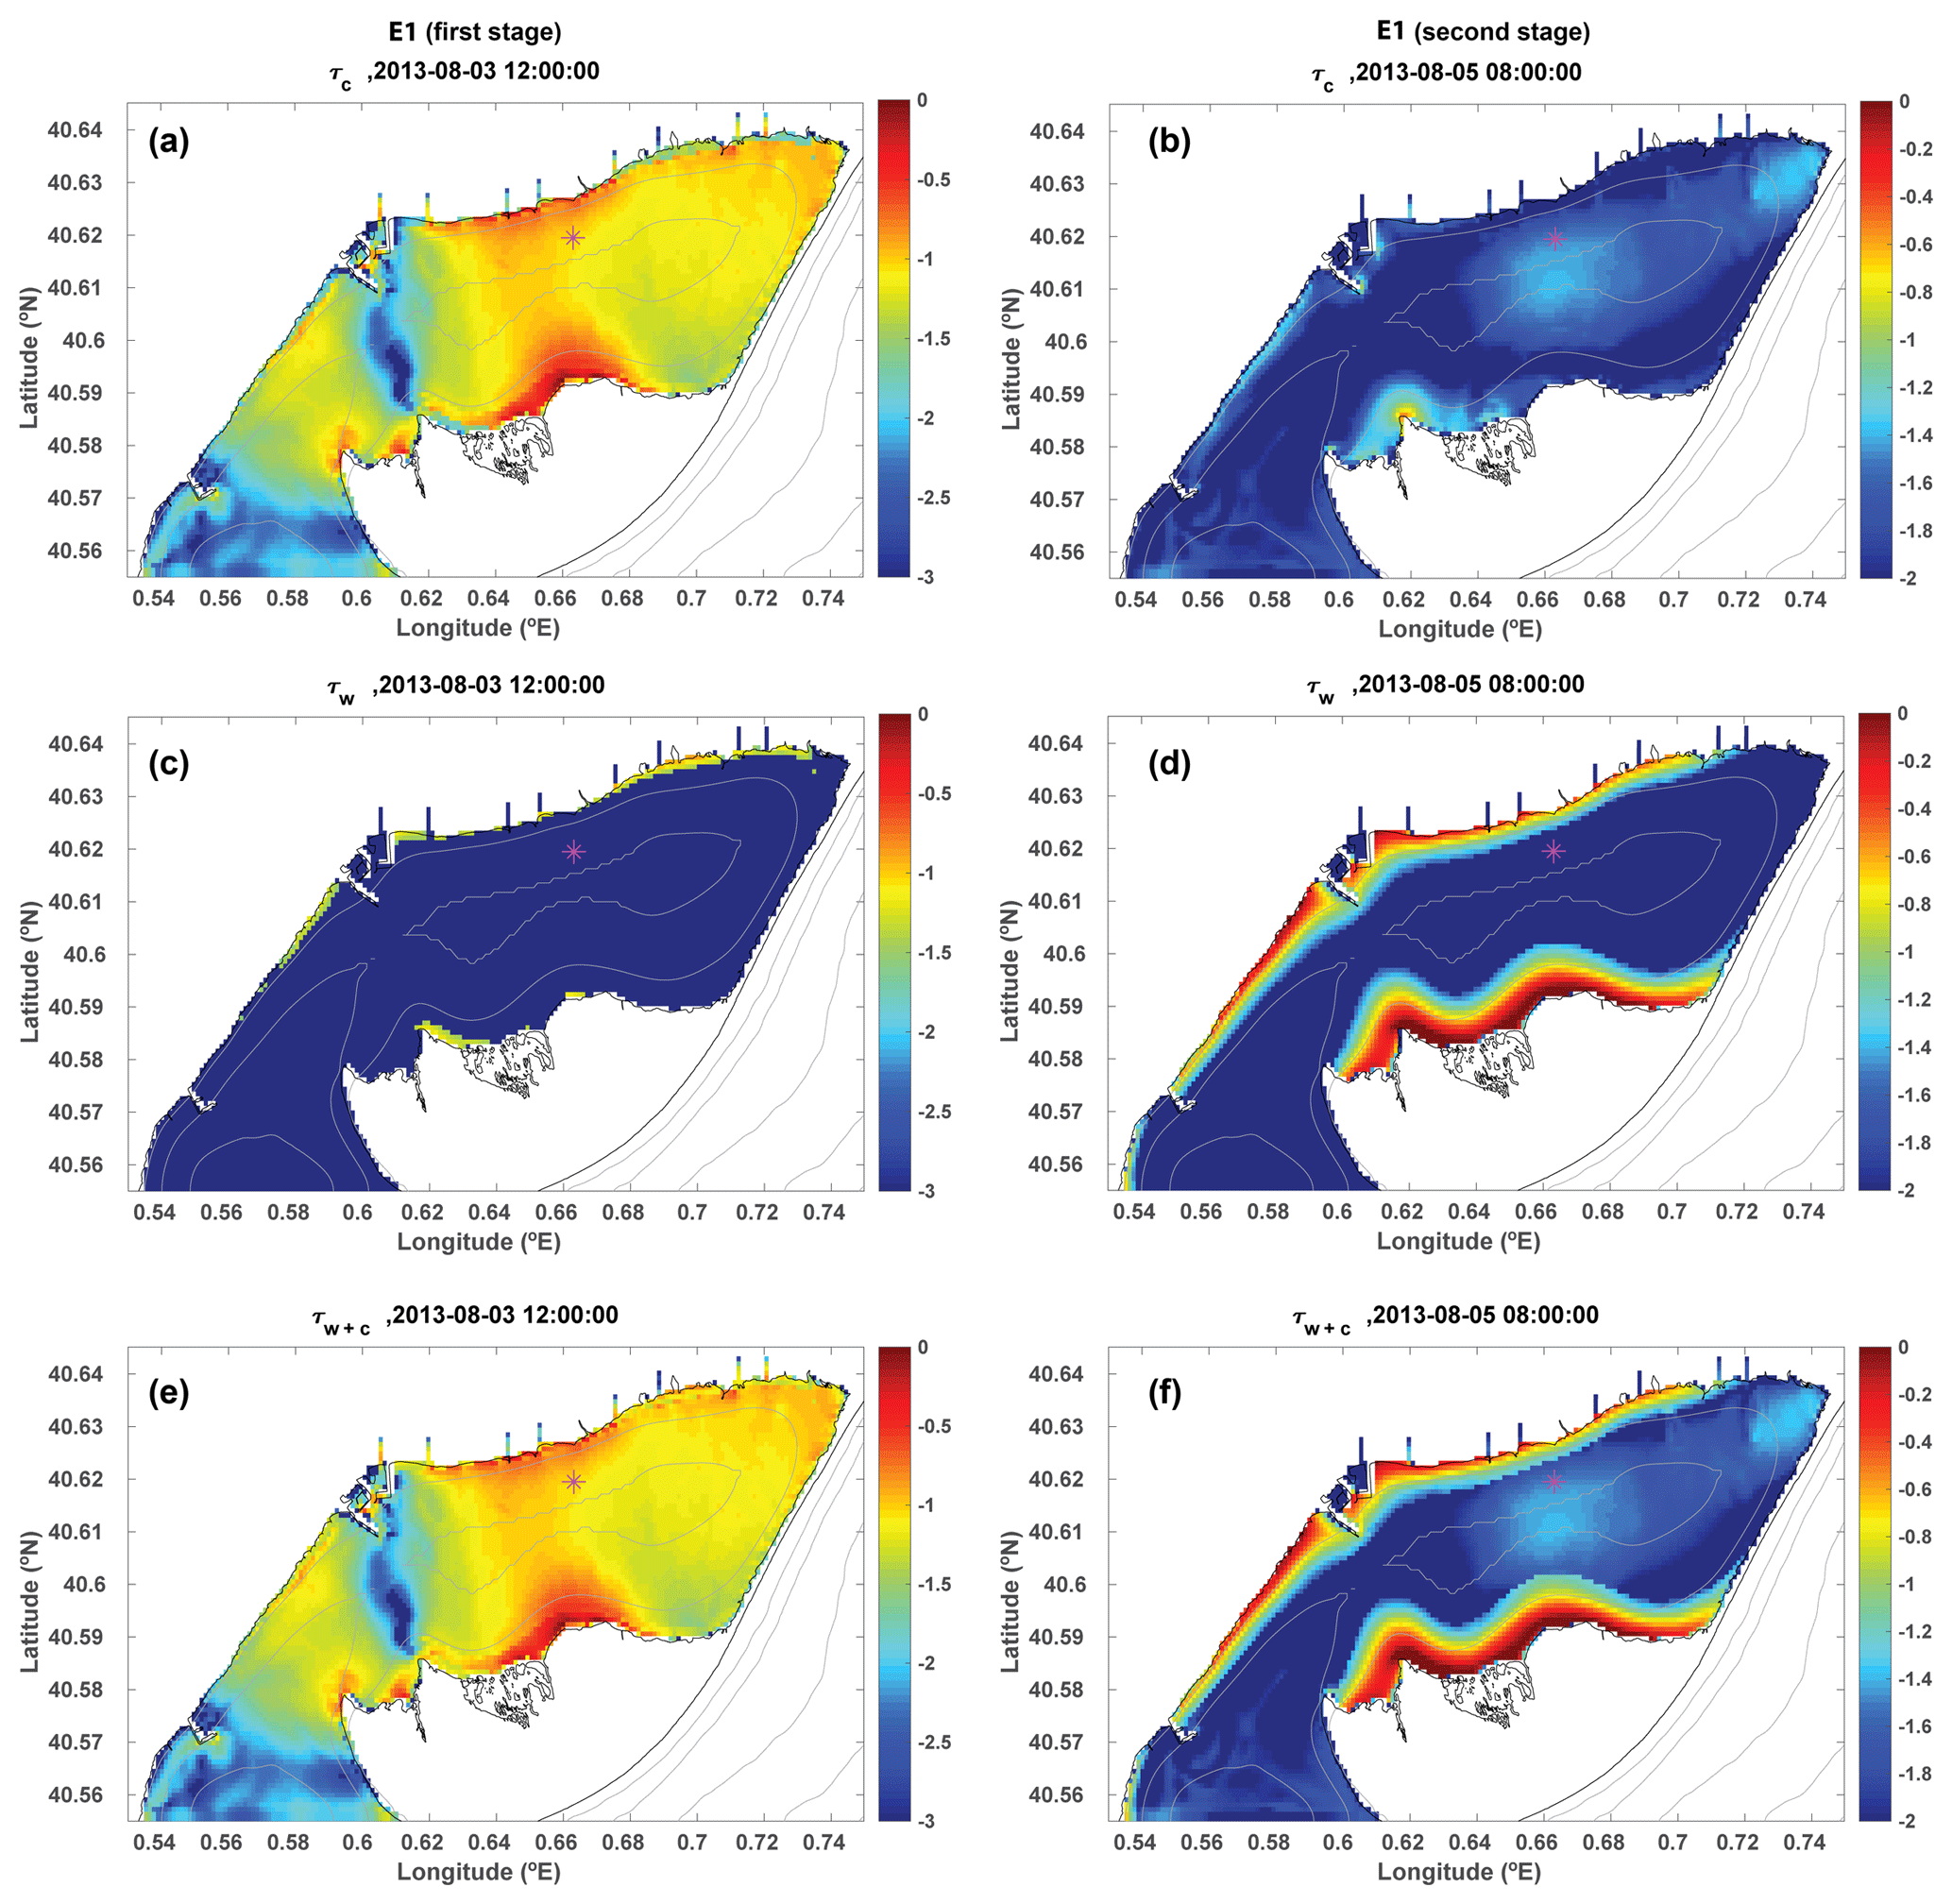
Figure 5Current-induced bottom stress (τc), wave-induced bottom stress (τw), and combined wave–current bottom stress (τwc) in Alfacs Bay during the first stage of the E1 episode (i.e. seiche; a, c, e) and the second stage of the E1 episode (i.e. sea breeze; b, d, f). The A2 station is shown in magenta. Isobaths are plotted using grey solid lines at 3 m intervals from 3 to 12 m. Note that for clarity, the bottom stresses are plotted in log 10 scale and the vertical range differs between both bottom stress distributions.
The bottom-stress pattern during episode E2 (Fig. 6a, c, e) is similar to the second stage of episode E1. Both wave and current bottom stress (08:00 GMT, 7 August) tend to be low at A2 in comparison to the seiche event. Substantial bottom stress is only observed on the shallow edges of the bay due to the wave action originating from the sea breeze.
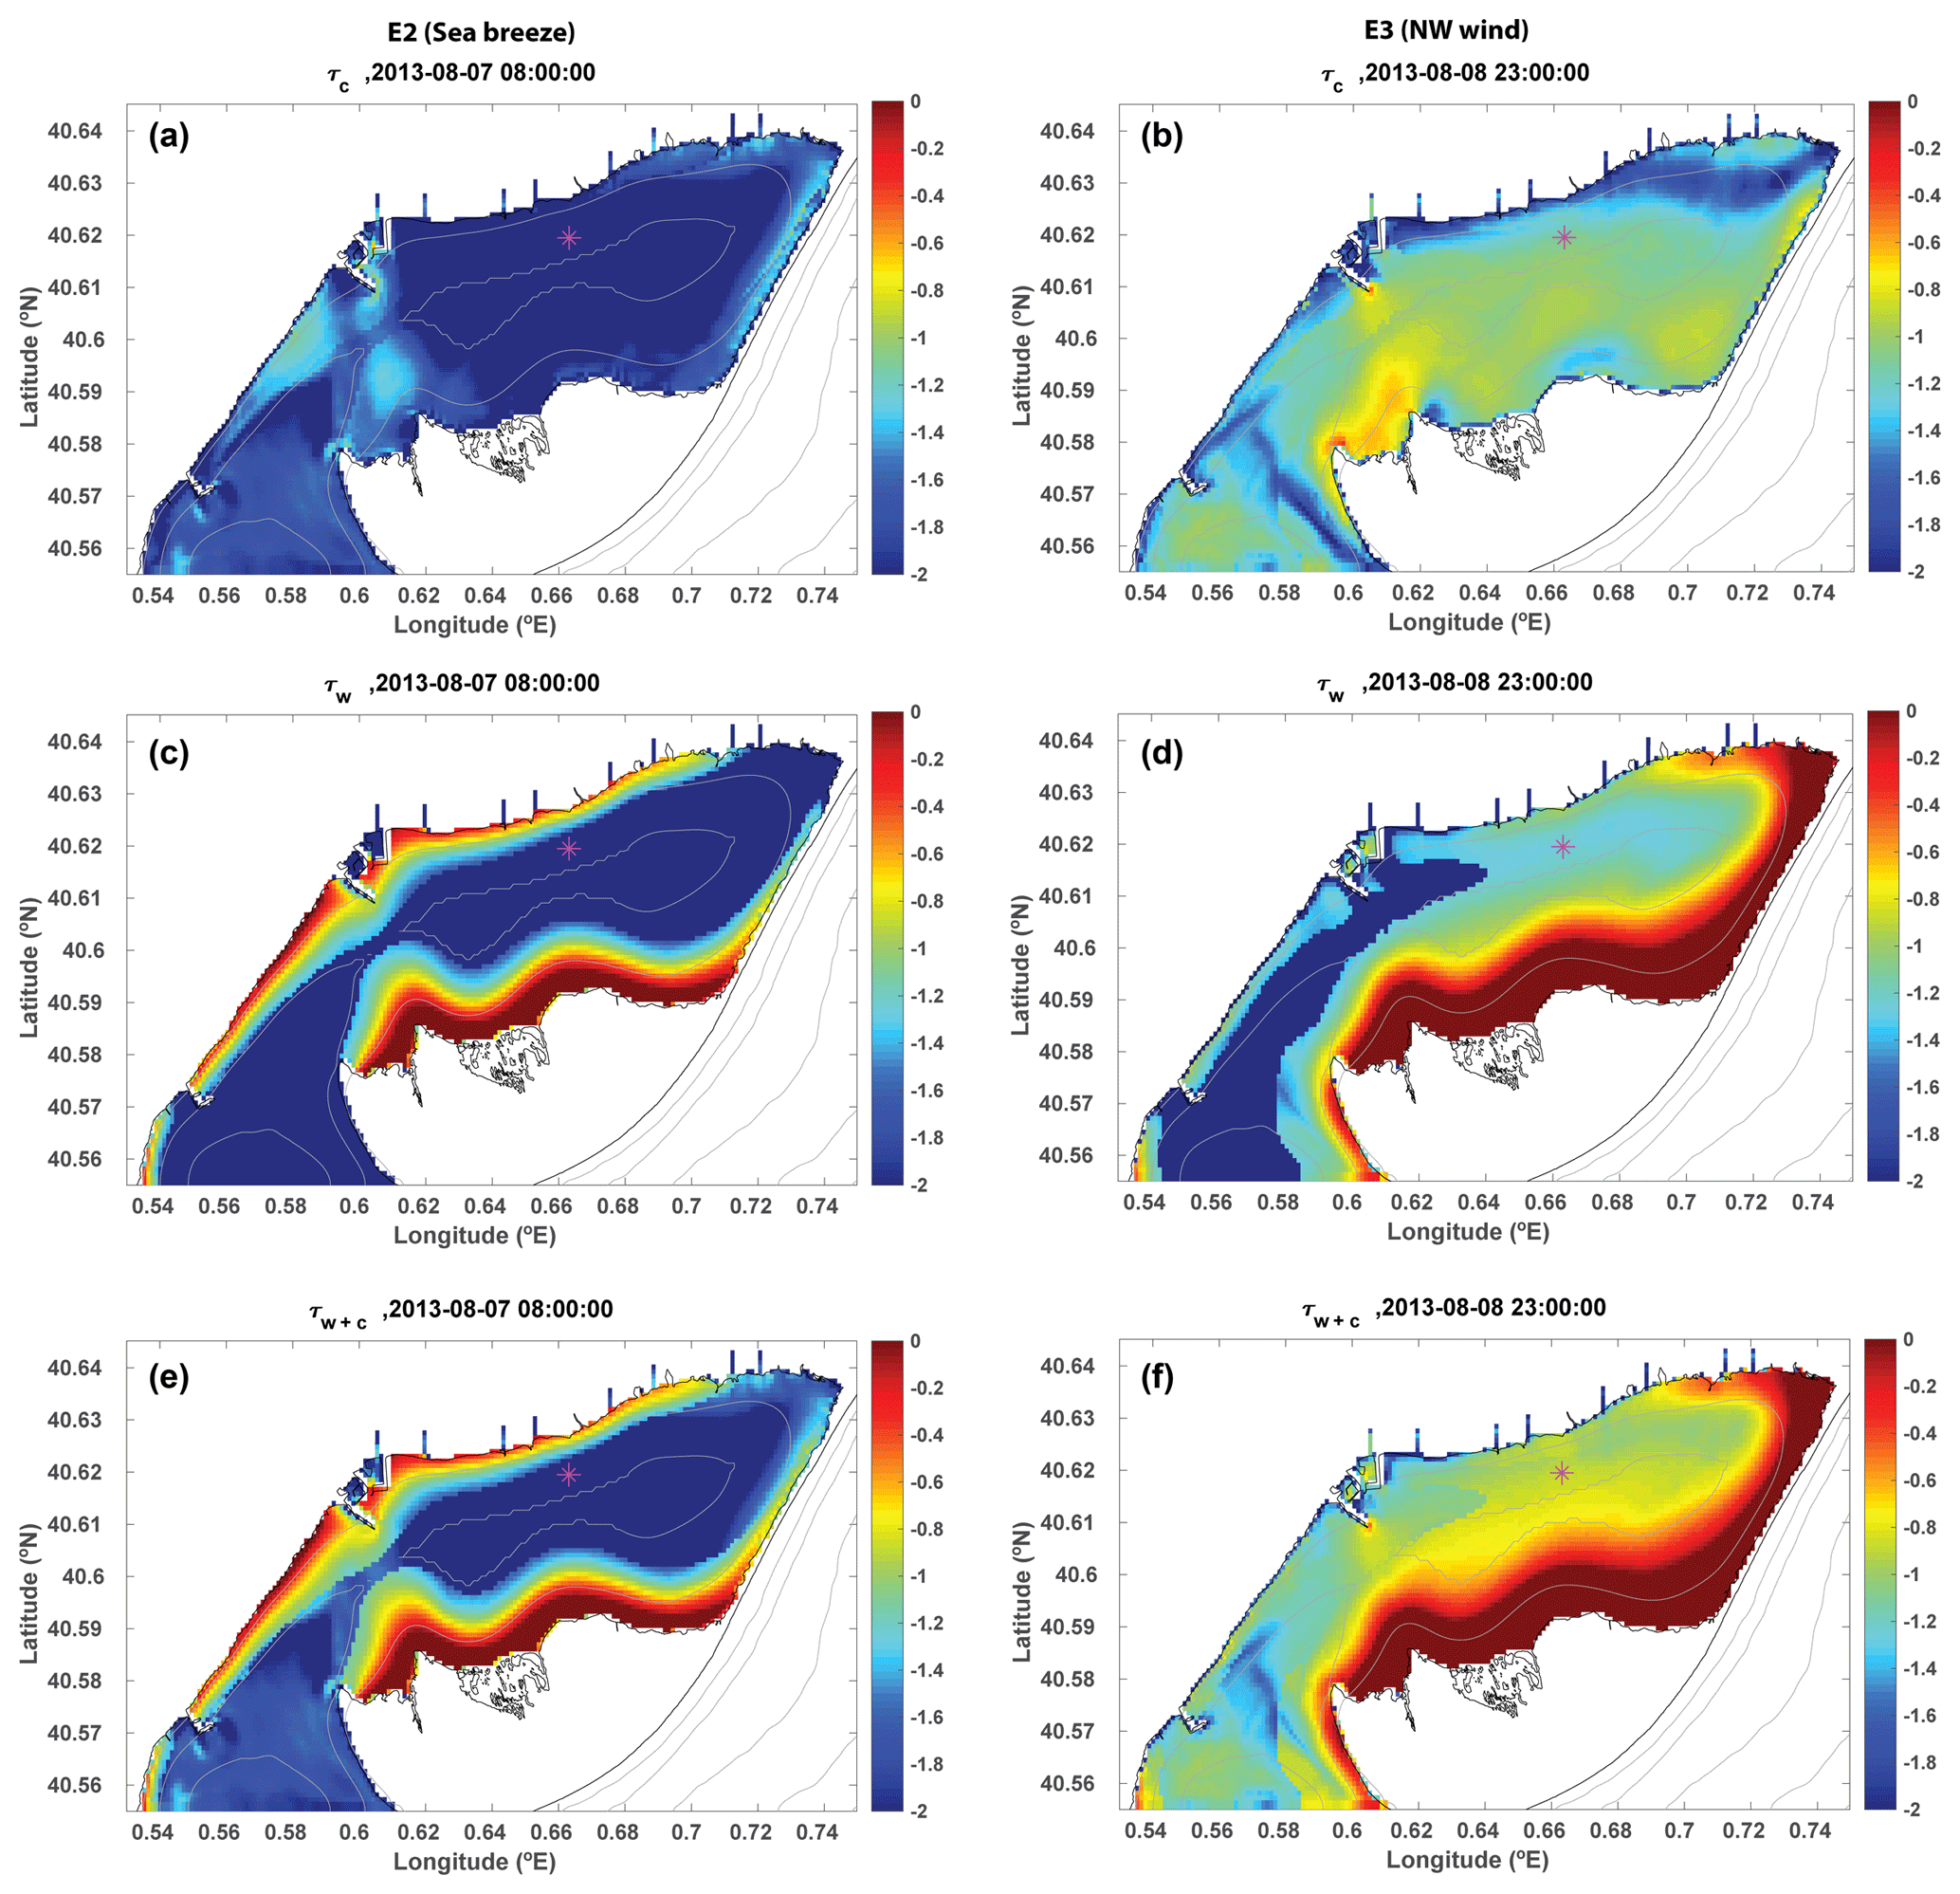
Figure 6Current-induced bottom stress (τc), wave-induced bottom stress (τw), and combined wave–current bottom stress (τwc) in Alfacs Bay during the first stage of the E2 (a, c, e) and E3 (b, d, f) episodes. The A2 station is shown in magenta. Isobaths (in grey) are plotted using grey solid lines at 3 m intervals from 3 to 12 m. Note that for clarity, the plot scale is transformed in log 10 scale and the vertical range differs between both bottom stress distributions.
During the E3 episode (northwesterly wind; Fig. 6b, d, f), the combined bottom stress (23:00 GMT, 8 August) is dominated by both wave and current action. The southern part of the bay shows that the maximum wave-induced bottom stress is consistent with the wave climate (Fig. 7). Furthermore, the current-induced bottom stress presents non-negligible values within the bay. Focusing on A2, both mechanisms contribute in a similar manner (wave and current bottom stress are 0.09 and 0.06 Pa respectively) to the combined bottom stress.
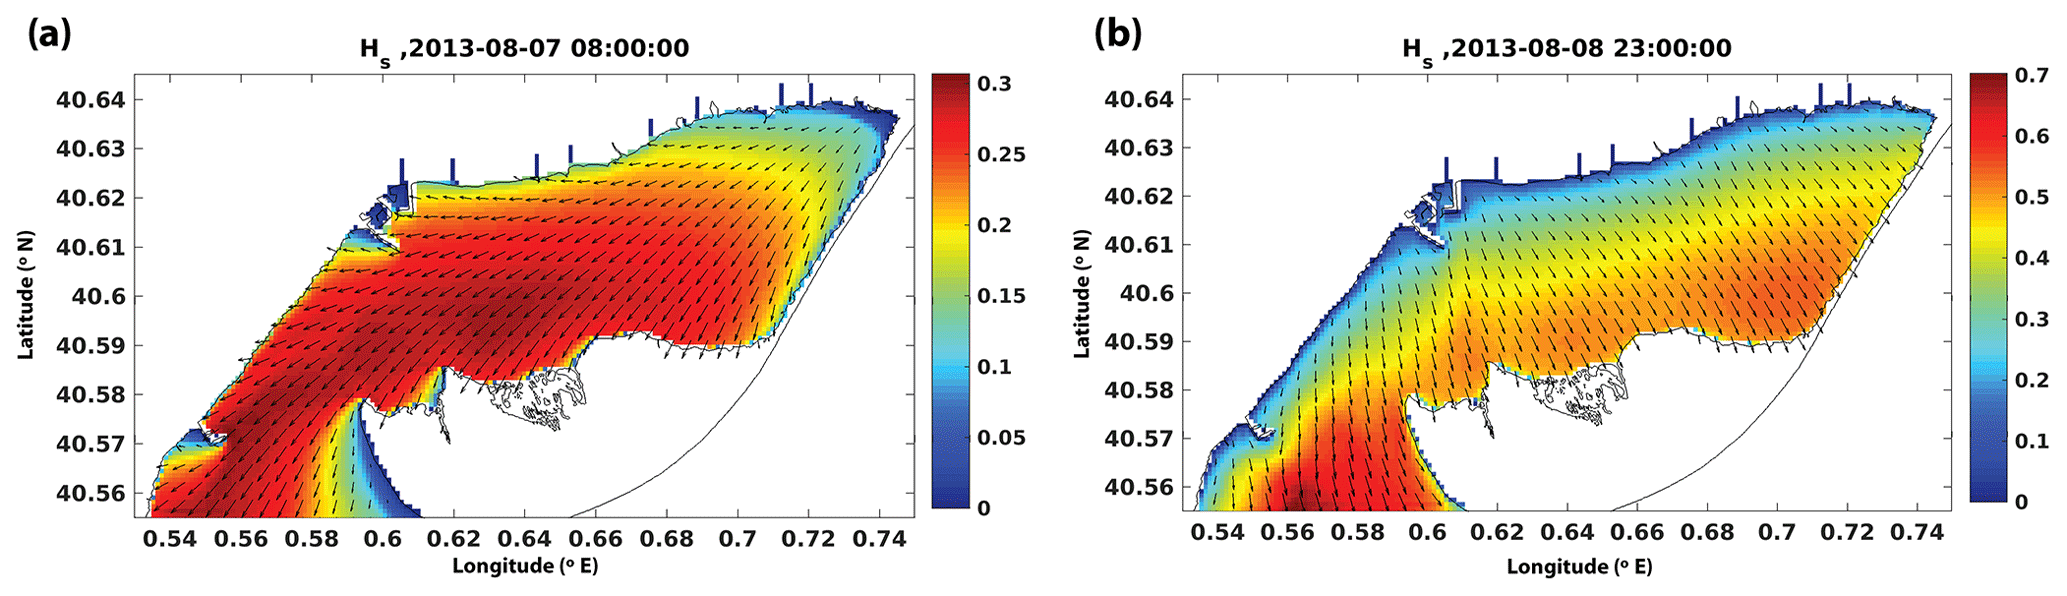
Figure 7Wave field for the E2 (sea breeze; a) and E3 (northwesterly wind; b) episodes. The colours represent the significant wave heights in metres, and black arrows denote the direction of propagation. Note that the value ranges of colour bars are different.
The synchronous time series of the meteo-oceanographic variables and turbidity shown in Fig. 2, in combination with the bottom stress model provides a good opportunity to characterize the turbidity peaks measured at A2. During the first stage of the E1 episode, the bottom current speed responds to the node–antinode pattern with velocities that increase to 0.4 m s−1 at A2. This increase of the bottom velocity causes bottom sediment resuspension and a turbidity peak (Fig. 2). Even if an increase in wind speed occurs (peaks that reach 8 m s−1), the oscillating pattern of 1 h periods of the current (see Fig. 3) polarizes strongly, following the along-shore direction. This suggests an increase in turbidity due to the seiche instead of the wind-driven current. The analysis of the modelled bottom stress during the E1 episode (Fig. 5) also suggests that the seiche is the main mechanism for turbidity increase at A2 during the first stage of the E1 event. Resuspension mechanisms in the water environment caused by seiches have been mentioned in observational investigations (Niedda and Greppi, 2007; Chung et al., 2009; Jordi et al., 2011). However, these studies have not explained the high spatial variability of the importance of the seiche-induced resuspension mechanism, which is implied by the modelled current-induced bottom stress. This means observational results regarding turbidity variability may differ significantly as a function of the location of the node–antinode and its consequent maximum and minimum velocities.
The turbidity still showed large values after the seiche had already dissipated and the bottom current had decreased during the second stage of the E1 event. Typical sea-breeze wind conditions were observed (gentle variation of wind direction from 30 to 180∘) with a noticeable increase in the wind speed on 4 August, which was unrelated to the measured bottom current speed. Llebot et al. (2014) and Cerralbo et al. (2015a) stated that the water current profiles due to winds observed in Alfacs Bay do not imply a barotropic shape in the water velocity profiles; this suggests a different behaviour near the bottom, compared with the surface, related to wind set-up phenomena. Consequently, the local resuspension due to wind seems unlikely in this area of the bay. It seems more feasible that high turbidity measured at A2 during E1 (second stage) is associated with advection of fine sediment that was previously resuspended by seiches or by sea-breeze activity on the shallow edges of the bay, with a subsequent transport towards the middle of the bay. This last mechanism would also explain the turbidity peak measured on 5 August at 00:00 GMT, after the fine-sediment settling occurred within the bay. The sediment advection within the bay is difficult to confirm according to our data, but Alfacs bathymetry shows a characteristic shallow edge near the coastline (water depths below 2 m; see Fig. 1). On these shallow edges the bottom stress increases by 0.8 Pa, suggesting potential sediment resuspension. The shallow edge may be a source of fine sediment under energetic wind conditions in the case of fine-sediment availability. Therefore, the advection of resuspended sediment highlights the relevance of the water current patterns within the bay for turbidity measurements.
Episode E2 is attributed to a sea-breeze mechanism. This event is qualitatively less important in terms of the turbidity measured at A2. The comparison of the sea-breeze events on 4 and 6 August (both have similar wind and bottom current speed but different turbidity values) seems to indicate the relevance of the previous events and the subsequent advection of fine sediment, following the mechanism explained previously. Similar to the second stage of E1, the bottom stress is low (below 0.02 Pa) in the central basin of the bay, indicating that local resuspension is unlikely. Consequently, the turbidity measured at A2 is probably due to advection processes of suspended sediment from the shallowest areas (combined bottom stress more than 0.8 Pa) in the central basin.
Finally, episode E3 corresponds to a strong northwesterly wind event with wind speeds in excess of 12 m s−1. The bottom current speed does not show significantly higher values during this episode, in comparison with calm periods. However, in contrast to the sea breeze, the sea waves generated by the northwesterly wind conditions are relevant to the resuspension mechanisms due to an increase in the wave-induced bottom stress (Fig. 6b, d, f). Unfortunately, the set-up of the ADCP did not allow us to record the oscillatory pattern derived from the orbital velocities generated by waves, and the relative importance of each resuspension mechanism (i.e. wind or waves) is difficult to quantify.
E2 and E3 are examples of two mechanisms that may increase the turbidity: wind-driven current and wind waves. In Alfacs Bay, the roles of these mechanisms in sediment resuspension are less clear that the role of seiches, as the former are a function of wind speed without any clear correlation between the wind module and the observed turbidity. The resuspension of fine sediment due to wind and wind waves in shallow environments has been reported in literature (Luettich et al., 1990; Ogston et al., 2000; Guillén et al., 2006; Bever et al., 2011; Grifoll et al., 2014b; Hawley et al., 2014; Martyanov and Ryabchenko, 2016; López et al., 2017). Some of these studies highlight the complexity of the sediment processes due to the temporal and spatial variability of the importance of resuspension mechanisms and the presence of available material to be resuspended. Apparently, this is the case in our observations, because similar wind conditions do not imply the same turbidity measurements. A good example is the sea-breeze wind events on 4, 5 and 6 August during which different turbidity values were observed. As mentioned in the previous section, advective fluxes and the sequence of events may play an important role in the observed water turbidity. Many authors have reported an apparent influence from advective fluxes correlated with the suspended sediment concentration after an initial deposition of fine sediment (Sherwood et al., 1994; Ogston et al., 2000; Guillén et al., 2006; Harris et al., 2008; Bever et al., 2009; Grifoll et al., 2014b). This means that on longer timescales, advection of sediment by currents may redistribute sediment and determine final deposition patterns (Wright and Nittrouer, 1995). This may be the mechanism responsible for the high turbidity observed under relatively low hydrodynamic conditions. For instance, the sea-breeze event on 2 August does not cause high turbidity, in contrast to the event on 5 August (second stage of the E1 event); this may indicate that an energetic event (i.e. seiche) could mobilize sediment, which is then easily resuspended in subsequent events. The lack of proportionality of the resuspension related to hydrodynamics is also found in extended data time series, where divergences are mainly associated with sediment availability on the bottom, among other factors (e.g. in Wiberg et al., 1994 or López et al., 2017). In the case of Alfacs Bay, more extended observations may clarify the relation between wind intensity, wind waves, seiches, and the amount of suspended sediment and fluxes, taking the sequence of energetic events into account.
The sediment distribution in Alfacs Bay (high percentage of silt and clay in the central basin and sand prevalence on the southern, eastern, and western shores) is consistent with the modelling results shown in this study, where larger bottom stress values were obtained in the lateral shallow edges due to the contribution of the wave-induced bottom stress in shallow areas. However, the deposition mechanism is a complex process, composed of an initial settling and a subsequent dispersal, as described in Wright and Nittrouer (1995). Further sediment transport simulations, including those considering sediment classes and erosion and settling effects, would help to investigate the sediment settling dynamics and its final deposition. These processes should include the cohesive nature of the fine sediment or other phenomena, such as armouring or bioturbation, which may modify the physical properties of the sediment layers (van Ledden et al., 2004; Amoudry and Souza, 2011).
The characteristics of the bay, such as the relatively narrow and shallow entrance, favour the trapping of fine sediments, fed either by the freshwater outflow or the exchange between the open sea and the inner bay. The trapping effect of the bay may entail the presence of a thin surface bottom layer of fine sediment that is easily subject to resuspension. This behaviour is typical of shallow and sheltered environments such as lagoons or lakes. According to Luettich et al. (1990) and Hofmann et al. (2011), regular resuspension events in sheltered and shallow water bodies prevent sediment consolidation and the formation of a cohesive sediment layer. This could explain the high turbidity values observed in Alfacs Bay under relatively weak conditions, such as sea-breeze events, which would likely not occur if the sediment was cohesive.
The Sentinel-2 satellites provide imagery which allows for the further identification of scenarios with resuspension linked to hydrodynamic forcing. Figure 8 shows the total suspended matter (TSM in mgr L−1) for Alfacs Bay in two differentiate scenarios: northwesterly wind and calm conditions. Without access to local calibration data, a generalized approach for TSM retrieval has been applied. Using the Sentinel Application Platform (SNAP; v. 6.0.0) the Level 1C Sentinel-2 MultiSpectral Instrument (MSI) data were converted to geophysical values (suspended sediment concentration) using the most recent version of the water quality processor “C2RCC” (v. 1.0); the C2RCC processor was run using default values. Following processing in SNAP the data were post-processed (tiles merged, and data noise corrected) and TSM maps were created. Northwesterly wind conditions increase the TSM substantially in the southeastern shallow edges; hence, this would be a source for the subsequent advection of fine sediment towards the central bay, as was stated in the previous paragraphs. In contrast, the values of TSM decrease significantly during calm conditions.

Figure 8Total suspended matter (TSM in milligrams per litre) obtained from Sentinel-2 imagery for Alfacs Bay for two different conditions: northwesterly winds (a, 27 December 2017) and calm conditions (b, 15 February 2018).
Also, the proximity of the Ebro River mouth (15 km at north) may increase the suspended sediment within the bay under specific circumstances. River discharge is the main driver of the Ebro River plume, followed by wind and regional oceanic circulation (Fernández-Nóvoa et al., 2015; Mestres et al., 2003). Analysis of the turbid plume by remote sensing products indicate that more than 70 % of the plume extension was located south of the river mouth, influenced by the regional oceanic circulation (Fernández-Nóvoa et al., 2015). Other external sediment sources may be associated with freshwater discharge from channels, overwash in the bar, flash floods from small creeks, or aeolian transport. A complete study of the suspended sediment dynamics will provide objective information to address the problem of degrading water quality within the bay, and will assess how to make use of natural mechanisms to limit undesirable concentrations of nutrients or pollutants. This applies in particular to harmful algae blooms that are prone to occur in the area under present and future conditions.
The observational set and the wave–current numerical results obtained for Alfacs Bay allowed for a thorough investigation of the resuspension mechanisms of fine sediment. The results indicate evidence of a clear mechanism of resuspension induced by eventual seiche events, which according to the bottom stress patterns may have a relevant spatial variability within the bay consistent with the node–antinode position. The wind and wind wave mechanisms are also responsible for fine-sediment resuspension during energetic wind events, especially in shallow areas of the bay. A similar contribution of current-induced bottom stress and wave-induced bottom stress in the assessment of the combined wave–current bottom stress is found for the northwesterly wind case. In the case of the sea breeze, the wave-induced bottom stress prevails. The lack of proportionality between the turbidity and the hydrodynamics highlights the relevance of the sequence of the events, suggesting an effect of advective sediment fluxes within the bay (from the lateral shallow edges to the middle of the bay) which increase the suspended sediment concentration. The trapping effect of the bay may entail the presence of a thin surface layer of fine sediment that is easily involved in resuspension, neglecting the expected cohesive effects. However, these points deserve further analysis using extended data sets and sediment transport modelling. The exchange of fine sediment between the bay and the open sea is also evident according to remote sensing images. However, these points require further analysis in the same fashion as the previously mentioned factors. As the Ebro Delta is a region with high-anthropogenic pressure, this research may contribute to furthering integrated development plans that consider sustainable aquaculture activities and climate change mitigation in the region.
Data from field campaigns and model outputs are available upon request from the first author.
MG led the research and the writing process. All co-authors contributed equally to this work.
The authors declare that they have no conflict of interest.
This article is part of the special issue “Coastal modelling and uncertainties based on CMEMS products”. It is not associated with a conference.
Data provided by Puertos del Estado and AEMET are greatly appreciated. This work received funding from the EU H2020 program under grant agreement no. 730030 (CEASELESS project). The authors also wish to thank the Secretaria d'Universitats i Recerca del Dpt. d'Economia i Coneixement de la Generalitat de Catalunya (Ref. 2014SGR1253) who supported the research group. Pablo Cerralbo acknowledges financial support from ECOSISTEMA (CTM2017-84275-R INECO/AEI/FEDER, UE). This paper contains modified Copernicus Sentinel data (2017/2018).
This paper was edited by Joanna Staneva and reviewed by three anonymous referees.
Amoudry, L. O. and Souza, A. J.: Deterministic coastal morphological and sediment transport modeling: a review and discussion, Rev. Geophys., 49, 1–21, https://doi.org/10.1029/2010RG000341, 2011.
Bever, A. J., Harris, C. K., Sherwood, C. R., and Signell, R. P.: Deposition and flux of sediment from the Po River, Italy: An idealized and wintertime numerical modeling study, Mar. Geol., 260, 69–80, https://doi.org/10.1016/j.margeo.2009.01.007, 2009.
Bever, A. J., McNinch, J. E., and Harris, C. K.: Hydrodynamics and sediment-transport in the nearshore of Poverty Bay, New Zealand: Observations of nearshore sediment segregation and oceanic storms, Cont. Shelf Res., 31, 507–526, https://doi.org/10.1016/j.csr.2010.12.007, 2011.
Booij, N., Ris, R. C., and Holthuijsen, L. H.: A third-generation wave model for coastal regions: 1. Model description and validation, J. Geophys. Res., 104, 7649, https://doi.org/10.1029/98JC02622, 1999.
Camp, J. and Delgado, M.: Hidrografía de las bahías del delta del Ebro, Investig. Pesq., 51, 351–369, 1987.
Carlin, J. A., Lee, G. hong, Dellapenna, T. M., and Laverty, P.: Sediment resuspension by wind, waves, and currents during meteorological frontal passages in a micro-tidal lagoon, Estuar. Coast. Shelf Sci., 172, 24–33, https://doi.org/10.1016/j.ecss.2016.01.029, 2016.
Cerralbo, P., Grifoll, M., Valle-Levinson, A., and Espino, M.: Tidal transformation and resonance in a short, microtidal Mediterranean estuary (Alfacs Bay in Ebre delta), Estuar. Coast. Shelf Sci., 145, 57–68, https://doi.org/10.1016/j.ecss.2014.04.020, 2014.
Cerralbo, P., Grifoll, M., and Espino, M.: Hydrodynamic response in a microtidal and shallow bay under energetic wind and seiche episodes, J. Mar. Syst., 149, 1–13, https://doi.org/10.1016/j.jmarsys.2015.04.003, 2015a.
Cerralbo, P., Grifoll, M., Moré, J., Bravo, M., Sairouní Afif, A., and Espino, M.: Wind variability in a coastal area (Alfacs Bay, Ebro River delta), Adv. Sci. Res., 12, 11–21, https://doi.org/10.5194/asr-12-11-2015, 2015b.
Cerralbo, P., Espino, M., and Grifoll, M.: Modeling circulation patterns induced by spatial cross-shore wind variability in a small-size coastal embayment, Ocean Model., 104, 84–98, https://doi.org/10.1016/j.ocemod.2016.05.011, 2016.
Cerralbo, P., Espino, M., Grifoll, M., and Valle-Levinsion, A.: Subtidal circulation in a microtidal Mediterranean bay, Sci. Mar., 82, 231–243, https://doi.org/10.3989/scimar.04801.16A, 2018.
Chung, E. G., Bombardelli, F. A., and Schladow, S. G.: Sediment resuspension in a shallow lake, Water Resour. Res., 45, 1–18, https://doi.org/10.1029/2007WR006585, 2009.
Ellis, J., Cummings, V., Hewitt, J., Thrush, S., and Norkko, A.: Determining effects of suspended sediment on condition of a suspension feeding bivalve (Atrina zelandica): Results of a survey, a laboratory experiment and a field transplant experiment, J. Exp. Mar. Biol. Ecol., 267, 147–174, https://doi.org/10.1016/S0022-0981(01)00355-0, 2002.
Fan, S., Swift, D. J. P., Traykovski, P., Bentley, S., Borgeld, J. C., Reed, C. W., and Niedoroda, A. W.: River flooding, storm resuspension, and event stratigraphy on the northern California shelf: observations compared with simulations, Mar. Geol., 210, 17–41, https://doi.org/10.1016/j.margeo.2004.05.024, 2004.
Fernández-Nóvoa, D., Mendes, R., deCastro, M., Dias, J. M., Sánchez-Arcilla, A., and Gómez-Gesteira, M.: Analysis of the influence of river discharge and wind on the Ebro turbid plume using MODIS-Aqua and MODIS-Terra data, J. Mar. Syst., 142, 40–46, https://doi.org/10.1016/j.jmarsys.2014.09.009, 2015.
Garel, E., Pinto, L., Santos, A., and Ferreira, Ó.: Tidal and river discharge forcing upon water and sediment circulation at a rock-bound estuary (Guadiana estuary, Portugal), Estuar. Coast. Shelf Sci., 84, 269–281, https://doi.org/10.1016/j.ecss.2009.07.002, 2009.
Ghosh, L. K., Prasad, N., Joshi, V. B., and Kunte, S. S.: A study on siltation in access channel to a port, Coast. Eng., 43, 59–74, https://doi.org/10.1016/S0378-3839(01)00006-0, 2001.
Giannakourou, A., Orlova, T. Y., Assimakopoulou, G., and Pagou, K.: Dinoflagellate cysts in recent marine sediments from Thermaikos Gulf, Greece: Effects of resuspension events on vertical cyst distribution, Cont. Shelf Res., 25, 2585–2596, https://doi.org/10.1016/j.csr.2005.08.003, 2005.
Grifoll, M., Gracia, V., Fernandez, J., and Espino, M.: Suspended sediment observations in the Barcelona inner-shelf during storms, J. Coast. Res., 2, 1533–1538, 2013.
Grifoll, M., Gracia, V., Aretxabaleta, A. L., Guillén, J., Espino, M., and Warner, J. C.: Formation of fine sediment deposit from a flash flood river in the Mediterranean Sea, J. Geophys. Res.-Oceans, 119, 5837–5853, https://doi.org/10.1002/2014JC010187, 2014a.
Grifoll, M., Gracia, V., Aretxabaleta, A., Guillén, J., Espino, M., and Warner, J. C.: Formation of fine sediment deposit from a flash flood river in the Mediterranean Sea, J. Geophys. Res.-Oceans, 119, 5837–5853, https://doi.org/10.1002/2014JC010187, 2014b.
Grifoll, M., Aretxabaleta, A. L., and Espino, M.: Shelf response to intense offshore wind, J. Geophys. Res.-Oceans, 120, 6564–6580, https://doi.org/10.1002/2015JC010850, 2015.
Grifoll, M., Navarro, J., Pallares, E., Ràfols, L., Espino, M., and Palomares, A.: Ocean–atmosphere–wave characterisation of a wind jet (Ebro shelf, NW Mediterranean Sea), Nonlin. Process. Geophys., 23, 143–158, https://doi.org/10.5194/npg-23-143-2016, 2016.
Guillen, J. and Palanques, A.: A shoreface zonation in the Ebro Delta based on grain size distribution, J. Coast. Res., 13, 867–878, 1997.
Guillén, J., Palanques, A., Puig, P., and Durrieu de Madron, X.: Field calibration of optical sensors for measuring suspended sediment concentration in the western Mediterranean, Sci. Mar., 64, 427–435, https://doi.org/10.3989/scimar.2000.64n4427, 2000.
Guillén, J., Bourrin, F., Palanques, A., Durrieu de Madron, X., Puig, P., and Buscail, R.: Sediment dynamics during wet and dry storm events on the Têt inner shelf (SW Gulf of Lions), Mar. Geol., 234, 129–142, https://doi.org/10.1016/j.margeo.2006.09.018, 2006.
Harris, C. K., Sherwood, C. R., Signell, R. P., Bever, A. J., and Warner, J. C.: Sediment dispersal in the northwestern Adriatic Sea, J. Geophys. Res., 113, C11S03, https://doi.org/10.1029/2006JC003868, 2008.
Hawley, N., Redder, T., Beletsky, R., Verhamme, E., Beletsky, D., and DePinto, J. V.: Sediment resuspension in Saginaw Bay, J. Great Lakes Res., 40, 18–27, https://doi.org/10.1016/j.jglr.2013.11.010, 2014.
Hofmann, H., Lorke, A., and Peeters, F.: Wind and ship wave-induced resuspension in the littoral zone of a large lake, Water Resour. Res., 47, 1–12, https://doi.org/10.1029/2010WR010012, 2011.
Jacob, R., Larson, J., and Ong, E.: Mn communication and parallel interpolation in CCSM3 using the Model Coupling Toolkit, Int. J. High Perf. Comp. App., 19, 293–308, 2005.
Jordi, A., Basterretxea, G., Casas, B., Anglès, S., and Garcés, E.: Seiche-forced resuspension events in a Mediterranean harbour, Cont. Shelf Res., 28, 505–515, https://doi.org/10.1016/j.csr.2007.10.009, 2008.
Jordi, A., Basterretxea, G., and Wang, D.-P.: Local versus remote wind effects on the coastal circulation of a microtidal bay in the Mediterranean Sea, J. Mar. Syst., 88, 312–322, 2011.
Kumar, N., Voulgaris, G., Warner, J. C., and Olabarrieta, M.: Implementation of the vortex force formalism in the coupled ocean-atmosphere-wave-sediment transport (COAWST) modeling system for inner shelf and surf zone applications, Ocean Model., 47, 65–95, https://doi.org/10.1016/j.ocemod.2012.01.003, 2012.
Llebot, C., Spitz, Y. H., Solé, J., and Estrada, M.: The role of inorganic nutrients and dissolved organic phosphorus in the phytoplankton dynamics of a Mediterranean bay: A modeling study, J. Mar. Syst., 83, 192–209, https://doi.org/10.1016/j.jmarsys.2010.06.009, 2010.
Llebot, C., Solé, J., Delgado, M., Fernández-Tejedor, M., Camp, J., and Estrada, M.: Hydrographical forcing and phytoplankton variability in two semi-enclosed estuarine bays, J. Mar. Syst., 86, 69–86, https://doi.org/10.1016/j.jmarsys.2011.01.004, 2011.
Llebot, C., Rueda, F. J., Solé, J., Artigas, M. L., and Estrada, M.: Hydrodynamic states in a wind-driven microtidal estuary (Alfacs Bay), J. Sea Res., 85, 263–276, https://doi.org/10.1016/j.seares.2013.05.010, 2014.
López, L., Guillén, J., Palanques, A., and Grifoll, M.: Seasonal sediment dynamics on the Barcelona inner shelf (NW Mediterranean): A small Mediterranean river- and wave-dominated system, Cont. Shelf Res., 145, 80–94, https://doi.org/10.1016/j.csr.2017.07.008, 2017.
Loureiro, S., Garcés, E., Fernández-Tejedor, M., Vaqué, D., and Camp, J.: Pseudo-nitzschia spp. (Bacillariophyceae) and dissolved organic matter (DOM) dynamics in the Ebro Delta (Alfacs Bay, NW Mediterranean Sea), Estuar. Coast. Shelf Sci., 83, 539–549, https://doi.org/10.1016/j.ecss.2009.04.029, 2009.
Luettich, R. A. J., Harleman, D. R. F., and Somlyódy, L.: Dynamic behavior of suspended sediment concentrations in a shallow lake perturbed by episodic wind events, Limnol. Oceanogr., 35, 1050–1067, https://doi.org/10.4319/lo.1990.35.5.1050, 1990.
Martyanov, S. and Ryabchenko, V.: Bottom sediment resuspension in the easternmost Gulf of Finland in the Baltic Sea: A case study based on three-dimensional modeling, Cont. Shelf Res., 117, 126–137, https://doi.org/10.1016/j.csr.2016.02.011, 2016.
Mehta, A. J.: On estuarine cohesive sediment suspension behavior, J. Geophys. Res.-Oceans, 94, 14303–14314, https://doi.org/10.1029/JC094iC10p14303, 1989.
Mestres, M., Sierra, J. P. A. U., Sánchez-Arcilla, A., González, J., Río, D. E. L., Wolf, T., and Rodríguez, A.: Modelling of the Ebro River plume. Validation with field observations, Scientia Marina, 67, 379–391, 2003.
Newcombe, C. P. and Macdonald, D. D.: Effects of Suspended Sediments on Aquatic Ecosystems, N. Am. J. Fish. Manage., 11, 72–82, https://doi.org/10.1577/1548-8675(1991)011<0072:EOSSOA>2.3.CO;2, 1991.
Niedda, M. and Greppi, M.: Tidal, seiche and wind dynamics in a small lagoon in the Mediterranean Sea, Estuar. Coast. Shelf Sci., 74, 21–30, https://doi.org/10.1016/j.ecss.2007.03.022, 2007.
Ogston, A., Cacchione, D., Sternberg, R., and Kineke, G.: Observations of storm and river flood-driven sediment transport on the northern California continental shelf, Cont. Shelf Res., 20, 2141–2162, https://doi.org/10.1016/S0278-4343(00)00065-0, 2000.
Palacín, C., Martin, D., and Gili, J. M.: Features of spatial distribution of benthic infauna in a Mediterranean shallow-water Bay, Mar. Biol., 321, 315–321, 1991.
Palanques, A., Lopez, L., Guillén, J., Puig, P., and Masqué, P.: Decline of trace metal pollution in the bottom sediments of the Barcelona City continental shelf (NW Mediterranean), Sci. Total Environ., 579, 755–767, https://doi.org/10.1016/j.scitotenv.2016.11.031, 2017.
Ramírez-Pérez, M., Gonçalves-Araujo, R., Wiegmann, S., Torrecilla, E., Bardaji, R., Röttgers, R., Bracher, A., and Piera, J.: Towards cost-effective operational monitoring systems for complex waters: Analyzing small-scale coastal processes with optical transmissometry, PLoS One, 12, 1–21, https://doi.org/10.1371/journal.pone.0170706, 2017.
Roque, A., Lopez-Joven, C., Lacuesta, B., Elandaloussi, L., Wagley, S., Furones, M. D., Ruiz-Zarzuela, I., De Blas, I., Rangdale, R., and Gomez-Gil, B.: Detection and identification of tdh- And trh-positive Vibrio parahaemolyticus strains from four species of cultured bivalve molluscs on the Spanish Mediterranean coast, Appl. Environ. Microbiol., 75, 7574–7577, https://doi.org/10.1128/AEM.00772-09, 2009.
Satta, C. T., Anglès, S., Lugliè, A., Guillén, J., Sechi, N., Camp, J., and Garcés, E.: Studies on dinoflagellate cyst assemblages in two estuarine Mediterranean bays: A useful tool for the discovery and mapping of harmful algal species, Harmful Algae, 24, 65–79, https://doi.org/10.1016/j.hal.2013.01.007, 2013.
Shchepetkin, A. F. and McWilliams, J. C.: The regional oceanic modeling system (ROMS): a split-explicit, free-surface, topography-following-coordinate oceanic model, Ocean Model., 9, 347–404, https://doi.org/10.1016/j.ocemod.2004.08.002, 2005.
Sherwood, C. R., Butman, B., Cacchione, D. A., Drake, D. E., Gross, T. F., Sternberg, R. W., Wiberg, P. L., and Williams, A. J.: Sediment-transport events on the northern California continental shelf during the 1990–1991 STRESS experiment, Cont. Shelf Res., 14, 1063–1099, https://doi.org/10.1016/0278-4343(94)90029-9, 1994.
Shteinman, B., Eckert, W., Kaganowsky, S., and Zohary, T.: Seiche-Induced Resuspension in Lake Kinneret: A Fluorescent Tracer Experiment, in: The Interactions Between Sediments and Water: Proceedings of the 7th International Symposium, 22–25 September 1996, Baveno, Italy, edited by: Evans, R. D., Wisniewski, J., and Wisniewski, J. R., Springer Netherlands, Dordrecht, 123–131, 1997.
Solé, J., Turiel, A., Estrada, M., Llebot, C., Blasco, D., Camp, J., Delgado, M., Fernández-Tejedor, M., and Diogène, J.: Climatic forcing on hydrography of a Mediterranean bay (Alfacs Bay), Cont. Shelf Res., 29, 1786–1800, https://doi.org/10.1016/j.csr.2009.04.012, 2009.
Sondergaard, M., Kristensen, P., and Jeppesen, E.: Phosphorus release from ressuspended sediment in the shallow and wind-exposed Lake Arreso, Denmark, Hydrobiologia, 228, 91–99, 1992.
Soulsby, R.: Dynamics of marine sands, Thomas Telford Publishing, London, UK, 1997.
Styles, R. and Glenn, S. M.: Modeling stratified wave and current bottom boundary layers on the continental shelf, J. Geophys. Res., 105, 24119–24139, https://doi.org/10.1029/2000JC900115, 2000.
Taylor, K. E.: Summarizing multiple aspects of model performance in a single diagram, J. Geophys. Res., 106, 7183–7192, https://doi.org/10.1029/2000JD900719, 2001.
van Ledden, M., van Kesteren, W. G., and Winterwerp, J.: A conceptual framework for the erosion behaviour of sand–mud mixtures, Cont. Shelf Res., 24, 1–11, https://doi.org/10.1016/j.csr.2003.09.002, 2004.
van Maren, D. S., van Kessel, T., Cronin, K., and Sittoni, L.: The impact of channel deepening and dredging on estuarine sediment concentration, Cont. Shelf Res., 95, 1–14, https://doi.org/10.1016/j.csr.2014.12.010, 2015.
Warner, J. C., Sherwood, C. R., Signell, R. P., Harris, C. K., and Arango, H. G.: Development of a three-dimensional, regional, coupled wave, current, and sediment-transport model, Comput. Geosci., 34, 1284–1306, https://doi.org/10.1016/j.cageo.2008.02.012, 2008.
Warner, J. C., Armstrong, B., He, R., and Zambon, J. B.: Development of a Coupled Ocean–Atmosphere–Wave–Sediment Transport (COAWST) Modeling System, Ocean Model., 35, 230–244, https://doi.org/10.1016/j.ocemod.2010.07.010, 2010.
Wiberg, P. L., Drake, D. E., and Cacchione, D. A.: Sediment resuspension and bed armoring during high bottom stress events on the northern California inner continental shelf: measurements and predictions, Cont. Shelf Res., 14, 1191–1219, https://doi.org/10.1016/0278-4343(94)90034-5, 1994.
Wright, L. D. and Nittrouer, C. A.: Dispersal of River Sediments in Coastal Seas: Six Contrasting Cases, Estuaries, 18, 494, https://doi.org/10.2307/1352367, 1995.