the Creative Commons Attribution 4.0 License.
the Creative Commons Attribution 4.0 License.
 | 16 Jul 2019
Segmented flow coil equilibrator coupled to a proton-transfer-reaction mass spectrometer for measurements of a broad range of volatile organic compounds in seawater
Charel Wohl
David Capelle
Anna Jones
William T. Sturges
Philip D. Nightingale
Brent G. T. Else
We present a technique that utilises a segmented flow coil equilibrator coupled to a proton-transfer-reaction mass spectrometer to measure a broad range of dissolved volatile organic compounds. Thanks to its relatively large surface area for gas exchange, small internal volume, and smooth headspace–water separation, the equilibrator is highly efficient for gas exchange and has a fast response time (under 1 min). The system allows for both continuous and discrete measurements of volatile organic compounds in seawater due to its low sample water flow (100 cm3 min−1) and the ease of changing sample intake. The equilibrator setup is both relatively inexpensive and compact. Hence, it can be easily reproduced and installed on a variety of oceanic platforms, particularly where space is limited. The internal area of the equilibrator is smooth and unreactive. Thus, the segmented flow coil equilibrator is expected to be less sensitive to biofouling and easier to clean than membrane-based equilibration systems. The equilibrator described here fully equilibrates for gases that are similarly soluble or more soluble than toluene and can easily be modified to fully equilibrate for even less soluble gases. The method has been successfully deployed in the Canadian Arctic. Some example data from underway surface water and Niskin bottle measurements in the sea ice zone are presented to illustrate the efficacy of this measurement system.
- Article
(3003 KB) -
Supplement
(2296 KB) - BibTeX
- EndNote


Volatile organic compounds (VOCs) are ubiquitously present throughout the atmosphere (Heald et al., 2008) and play important roles in the chemistry of ozone (Monks, 2005) and OH radicals (Lewis et al., 2005) as well as in particle formation (Blando and Turpin, 2000). For example, acetone, acetaldehyde, and methanol particularly affect the oxidative capacity of the remote marine atmosphere (Lewis et al., 2005). The oxidation products of dimethyl sulfide (DMS) and isoprene are important particle precursors in the marine atmosphere that may affect cloud formation and the Earth's radiative balance (Charlson et al., 1987; Claeys et al., 2004). Benzene and toluene are organic pollutants typically emitted from anthropogenic sources, e.g. by ship traffic (Saeed and Al-Mutairi, 1999). The oceans play an important role in controlling atmospheric VOC concentrations by exchanging VOCs with the atmosphere (Carpenter et al., 2012).
Current estimates of air–sea VOC fluxes and the cycling of VOCs in the oceans have been limited in part by our ability to measure these compounds in surface seawater. For example, global budgets for acetone highlight the uncertainty of oceanic emissions (Fischer et al., 2012). A more recent sensitivity analysis stresses the importance of accurate oceanic mixed layer concentrations on the global acetone budget, especially in the Southern Hemisphere (Brewer et al., 2017).
Only a small number of methods allow for in situ quantification of VOCs. For example, derivatisation methods have been used, which require the synthesis of toxic chemicals to determine aldehyde concentrations in seawater with detection by high-performance liquid chromatography (Zhu and Kieber, 2018). Such methods are not suitable for measuring a large number of samples. Most methods of detection require the analyte to be in the gas phase, necessitating an adequate extraction or equilibration device.
Some dissolved gas concentration measurements have been made using purge-and-trap (PT) systems coupled to gas chromatograph–mass spectrometers (de Bruyn et al., 2017). This method is sensitive enough to allow for detection in seawater (quantification down to nmol dm−3) but requires manual handling and is often more suitable for discrete measurements. A gas chromatograph–mass spectrometer has been coupled to a PT system to measure benzene and toluene amongst other compounds (Huybrechts et al., 2000). Others have coupled PT systems to a gas chromatograph–flame ionisation detector to measure isoprene (Exton al., 2012), ethanol, and propanol in seawater (Beale et al., 2010). These setups are only suitable for discrete samples with a sample treatment time of under 2 h, and care must be taken to avoid wall adsorption and desorption effects in the setup. A ship-based PT gas chromatograph–mass spectrometer has been used to measure a broad range of VOCs in discrete surface water samples with a 3 h frequency; this required two people and represented a considerable workload (Schlundt et al., 2017). Some purge-and-trap systems have been automated to allow for underway measurements of halocarbons, DMS, and isoprene semi-continuously every ca. 30 min (Andrews et al., 2015). The fairly long measurement times preclude high-resolution measurements of these biologically reactive and short-lived gases. This highlights the need for continuous, fast, and automated measurement techniques that do not require pretreatment.
Two types of equilibrators are commonly used for continuous measurements of dissolved gases. One type allows for direct exchange between the carrier gas and the water, while the other uses a membrane to extract gases. Directly exchanging equilibrators such as the Weiss-style showerhead equilibrator (Johnson, 1999) allow for underway CO2 measurements with a < 35 min frequency. This has been widely used to measure CO2 and short-lived halocarbons (Arévalo-Martínez et al., 2013; Butler et al., 2007). However, spray generated from the showerhead lengthens the equilibrator's response time for highly soluble gases, making it less suitable for high-frequency measurements of highly soluble VOCs such as methanol (Kameyama et al., 2010). Membrane equilibrators avoid spray formation and allow for selective diffusion. Hollow fibre membranes have previously been used for measurement of dissolved CO2 (Hales et al., 2005; Sims et al., 2017) and DMS (Tortell, 2005; Yang et al., 2011). By using a hydrophobic membrane, the amount of water vapour in the detector can be reduced. For example, membrane-inlet mass spectrometers have been used to measure DMS and inorganic gases in seawater with a measurement frequency of more than once per minute (Tortell, 2005). Underway measurements of seawater DMS concentrations have been made with a 1 min frequency using a chemical ionisation mass spectrometer (CIMS) coupled to a porous Teflon membrane (Saltzman et al., 2009). One disadvantage of membrane equilibrators is that the equilibration efficiency could be affected by biological growth on the membrane surface (biofouling), especially in biologically productive areas where some VOCs are known to have strong sources.
Extracted or equilibrated air from seawater contains a large amount of water vapour, which potentially affects the sensitivity of VOC detection and could cause condensation in the sample tube. Thus, a dryer is often used to reduce the humidity in the sample air for measurements of gases including DMS and CO2. Measurement of very soluble and/or sticky gases, such as methanol or acetone, is problematic with this approach due to gas adsorption and desorption on the dryer or tubing material (Beale et al., 2011; Kameyama et al., 2010). Thus, the effect of high sample humidity needs to be considered in the design of the measurement system.
The choice of detector that the equilibrator is coupled to is crucial as well. Proton-transfer-reaction mass spectrometry (PTR-MS) is a widely used tool that allows for high-frequency (0.1–1 s) measurement of a broad range of trace gases in the atmosphere (Lindinger and Jordan, 1998; Blake et al., 2009). It is similarly suitable for high-resolution ship-based measurements of VOCs. Efforts have been made to quantify methanol, acetone, and acetaldehyde in discrete water samples using a membrane system coupled to PTR-MS (Beale et al., 2011). This represents a significant advance over the methods described above as there is no need for sample pretreatment and the setup does not contain reactive surfaces. Others have used a PT system coupled to PTR-MS to measure four different VOCs at a time (Williams et al., 2004). A bubbling-type equilibrator has also been developed for underway measurements of a range of dissolved VOCs with PTR-MS (Kameyama et al., 2010). The large volume of the bubbling equilibrator (inner diameter 15.2 cm, height 100 cm) creates a long response time (up to 18–19 min e.g. for methanol). Moreover, the high-water-flow requirement of this type of equilibrator (1 dm3 min−1) makes it less suitable for discrete measurements.
In this paper we extend the application of the segmented flow coil equilibrator (SFCE). It is adopted from the designs used by Xie et al. (2001) and Blomquist et al. (2017) for measurements of carbon monoxide and DMS, respectively. We couple this equilibrator to a PTR-MS with the settings optimised for measurement of a broad range of dissolved VOCs in humid equilibrator headspace. The main aim is to build an equilibrator that fully and rapidly equilibrates for the very soluble OVOCs (oxygenated volatile organic compounds, in this paper referring to methanol, acetone, and acetaldehyde). The equilibrator is described in detail in Sect. 2.1. The effect of humidity on the dissolved gas measurements by the PTR-MS is described in Sect. 2.2 and in the Supplement. The computation of dissolved VOC concentrations is described in Sect. 3.2. The choice of blanks, or backgrounds for dissolved VOC measurements, is discussed and described in Sect. 4.1. We assess the performance of the SFCE coupled to PTR-MS in Sect. 4, focusing in particular on the equilibration efficiency (Sect. 4.2), response time (Sect. 4.3), and limit of detection (Sect. 4.4). Installation of the SFCE on a ship along with some sample data from an Arctic cruise are presented in Sect. 5.
2.1 Segmented flow coil equilibrator
The design of our SFCE is shown in Fig. 1. The SFCE is coupled to PTR-MS for measurement of methanol, acetone (2-propanone), acetaldehyde (ethanal), dimethyl sulfide (DMS), isoprene (2-methyl-1,3-butadiene), benzene, and toluene (methyl benzene). These gases cover a large range of solubilities (see Sect. 4.2.1), demonstrating the versatility of the SFCE. The main advantage of this equilibrator lies in its design. Briefly, the segmented flow allows for a large surface area for gas exchange, ample equilibration time, and thus a high degree of equilibration. The simple headspace and water separation system allows for rapid drainage of the sampled water as well as separation of the headspace from water without spray or droplet formation. This enables a fast response time. Due to the ease of changing the water sample intake and low water flow, the equilibrator can conveniently be used for both continuous underway and discrete measurements. The equilibrator is entirely made up of commercially available polytetrafluoroethylene (PTFE) tubing and fittings, which should minimise adsorptive loss and make the equilibrator relatively inexpensive and easy to replicate. The constant flow of water and smooth surfaces should also reduce biofouling and facilitate occasional cleaning.
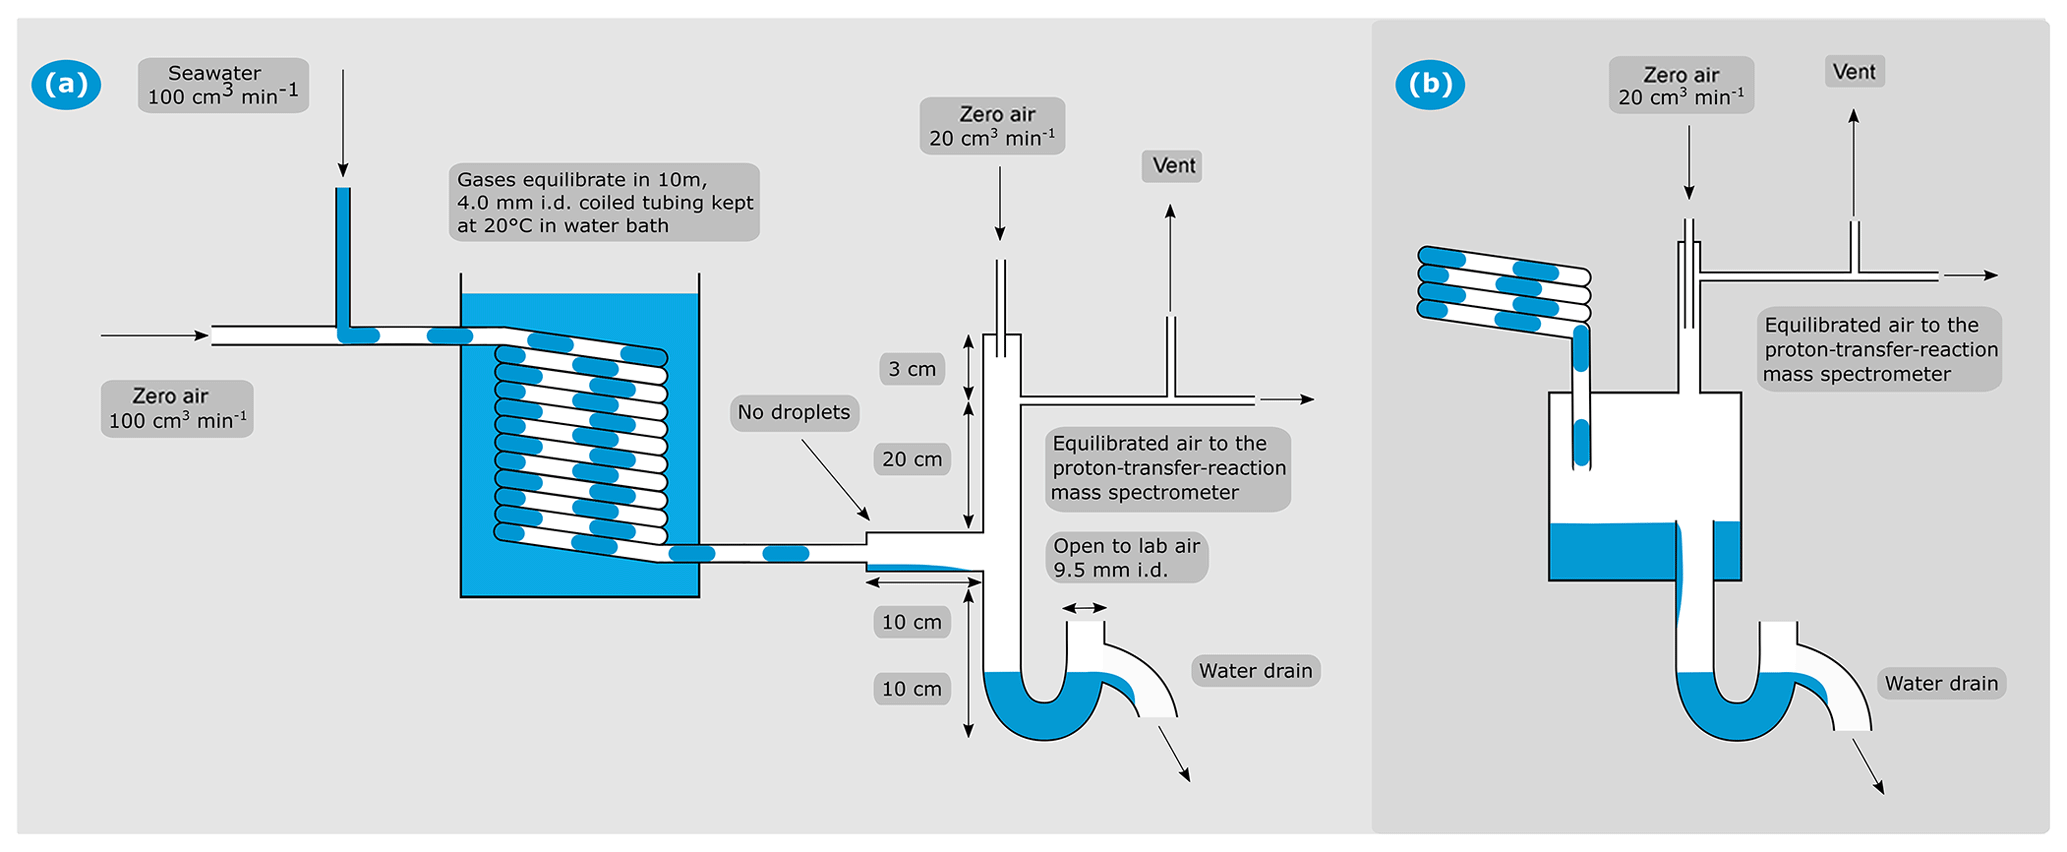
Figure 1(a) Schematic of the segmented flow coil equilibrator coupled to PTR-MS. (b) Schematic of the jar that was used during the field testing presented here for air–water separation. All other aspects of the SFCE were the same for the two designs.
In our setup, the SFCE takes approximately equal, continuous flows of high-purity zero air (100 cm3n min−1, where the letter n indicates normalised mass flow at 0 ∘C, 1 atm; controlled by a Bronkhorst mass-flow controller) and unfiltered seawater (100±5 cm3 min−1, controlled by a peristaltic pump, Watson Marlow 120 S/DV with 8 cm long Pumpsil platinum-cured silicone tubing with 4.4 mm inner diameter). We used either ultra-low-VOC zero air (Praxair) scrubbed by a hydrocarbon trap or British Technical Council approved (BTCA) zero air (BOC) oxidised by a custom-made platinum catalyst (heated to 450 ∘C) as the zero air carrier gas for the SFCE. Complete oxidation of VOCs in the custom-made PT catalyst has been demonstrated previously for both dry air and air that is fully saturated with water at 20 ∘C (Yang and Fleming, 2019).
The seawater is pumped either from the ship's underway water system or, in the case of discrete measurements, via 900 cm3 glass sample bottles (Sect. 5.1). The carrier gas and water meet in a PTFE tee piece (4 mm inner diameter), which naturally leads to the formation of distinct segments of zero air and water. The segments travel through a coiled, 10 m long PTFE tube (outer diameter 6.35 mm, wall thickness 1.19 mm). Each segment of carrier gas or water is approximately 1.5 cm long, giving an approximate total surface of exchange of 82 cm2 in the coil. The coil is immersed in a water bath kept at a constant temperature of 20 ∘C. The residence time in the 10 m tube is approximately 0.6 min. Laboratory measurements indicate that regardless of the initial water temperature (0–25 ∘C), the water exiting the equilibrator has a temperature of 20±1 ∘C. Keeping the temperature essentially constant has the benefit of (i) simplifying calibrations and calculations of aqueous concentration and, (ii) in the case of cold high-latitude seawater samples, increasing the VOC signal in the headspace as warming to 20 ∘C reduces the gas solubility. A rapid biological response to this warming is not expected in the segmented flow coil due to the very short residence time of 0.6 min.
In the initial design, after equilibration in the coiled segmented flow tube, the equilibrated air–water mixture is separated in a 200 cm3 PTFE jar (Savillex). Here, the sample gas travels towards the PTR-MS and the seawater drains away rapidly via a U-shaped drain (Fig. 1b). The U-shaped drain prevents intrusion of lab air and prevents the sample air from escaping via the water drain. We estimate a response time of about 2 min with the PTFE jar as the air–water separator. This is due to a combination of its sizable internal volume and the production of sea spray inside the jar due to falling droplets. The latter buffer the headspace to step changes in seawater concentration in the case of highly soluble gases. After the Arctic field deployment, the PTFE jar was found to slightly outgas some VOCs (see Sect. 4.1 for further information) and was replaced with a PTFE tee piece (Swagelok, outer diameter 12.7 mm, wall thickness 1.6 mm). This modification improved the system response time to less than 1 min by greatly reducing the volume of the air–water separator and allowing for a smooth separation of the equilibrated air–water mixture without droplet formation (see Sect. 4.3). Thus, the entire SFCE consists of readily available PTFE tubing and fittings routinely used for air sampling. See Fig. 1 for these two designs.
On the top end of the air–water separator, the humid headspace (100 cm3n min−1) is diluted with dry zero air (20 cm3n min−1, same as the carrier gas, controlled by another Bronkhorst mass-flow controller). This prevents condensation in the ∼2 m PTFE tubing between the equilibrator and the heated (80 ∘C) inlet of the PTR-MS (Fig. 1). The SFCE system is operated at a slight over-pressure (approx. 0.024 mbar above atmospheric pressure) in order to reduce the likelihood of lab air contamination (e.g. due to leaks). A vent is installed upstream of the PTR-MS to avoid pressurising the detector. The vent flow is typically ∼20 cm3 min−1 – the residual between the carrier gas flow (100 cm3n min−1), the dilution flow (20 cm3n min−1), and the PTR-MS intake flow (∼100 cm3 min−1).
The entire SFCE system fits on a bench space of about 40 by 40 cm (see the Supplement). Importantly, the SFCE is designed such that the failure of an individual component does not result in a catastrophic over- or under-pressurisation of the system. For example, if the carrier gas is stopped (e.g. gas supply runs out), the PTR-MS simply measures lab air via the vent and the water is drained from the SFCE as usual. If the water flow from the underway sampling stops, the peristaltic pump will simply pump lab air into the equilibrator. These unexpected failures can be easily identified as lab air typically has much higher concentrations of VOCs than equilibrator headspace in a marine environment. If the PTR-MS fails, the headspace gas simply exits via the vent and/or the top of the U-shaped drain.
Due to the smooth surfaces and constant and complete water renewal, the equilibrator should not be very prone to biofouling. The lack of a membrane for gas exchange means that the degree of equilibration should not vary significantly even if there is some biofouling. To clean the SFCE if necessary, the seawater intake and the water drain pipe are connected to a 10 % HCl solution for 10 min. During this procedure, the PTR-MS is disconnected to sample lab air and the gas flow is stopped. A flow of HCl thus covers all the parts of the equilibrator that are normally exposed to seawater. To resume measurement of ambient seawater, the flow of HCl is stopped and the carrier gas flow is started to drain the HCl safely into the recirculated solution. The equilibrator is typically rinsed with seawater before resuming measurement.
2.2 PTR-MS operation
Equilibrator headspace mixing ratios were initially computed using compound-specific rate constants of the reaction between the VOC in question and the hydronium ions in the drift tube of the mass spectrometer (Yang et al., 2013a; Zhao and Zhang, 2004). Pre- and post-cruise dynamic gas-phase calibrations using a gravimetrically prepared VOC gas standard (Apel-Riemer Environmental Inc., Miami, Florida, USA; nominal volume mixing ratio of 500 ppbv for acetaldehyde, methanol, acetone, isoprene DMS, benzene, toluene) and two Bronkhorst mass-flow controllers agree within 15 % of the computed mixing ratios for all VOCs except isoprene. Isoprene was found to fragment significantly: 17 % of the isoprene molecules are found at the primary ion (m∕z 69) and 30 % and 53 % were found at the fragment ion m∕z 41 and 39, respectively. This is in general agreement with Schwarz et al. (2009). This fragmentation ratio increases with increasing drift tube voltage (see the Supplement). It is possible that some of the mass 79 measured here contains a contribution from fragmenting toluene. However, because the gas standard contains both compounds, it is not straightforward to evaluate the magnitude of this interference.
The PTR-MS measurements can be affected by humidity. Our use of a dilution flow lowers the humidity in the sample gas by 20 % and thereby reduces the measurement sensitivity to humidity. To check for the effect of humidity on the PTR-MS measurement, gas calibrations were carried out at different humidities using three Bronkhorst mass-flow controllers. To produce carrier gas air at different humidities, a flow of moist air saturated in humidity at 20 ∘C is generated by passing zero air through a wetted SFCE and diluted by varying amounts of dry zero air directly from a gas cylinder. This mixture is scrubbed by the PT catalyst (which does not appear to change the humidity levels) and then added to the flow of VOC gas standard.
The signal of most VOCs monitored is independent of the sample humidity. However, isoprene, benzene, and toluene show a weak humidity dependence in their gas-phase calibrations. Changing the humidity in sample air from completely dry to nearly saturated in humidity at 20 ∘C, the abundance of the isoprene primary ion increases by 33 % (see the Supplement). This is because the hydronium water clusters do not cause isoprene fragmentation upon ionisation (Schwarz et al., 2009). The opposite is observed with benzene and toluene: primary ion abundance was found to decrease by 12 % and 18 %, respectively, over same humidity range. This is because hydronium water clusters have a lower ionisation energy, thus ionising benzene and toluene less effectively (de Gouw and Warneke, 2007; Warneke et al., 2001); see the Supplement. The humidity-dependant slopes from the gas-phase calibrations were used to correct the measured equilibrator headspace mixing ratios. For a more detailed discussion on the settings of the PTR-MS during deployment, the computation of VOC mixing ratios in the PTR-MS, and the effects of humidity on the signal amplitude and background, please see the Supplement.
The PTR-MS measures VOC mixing ratios (ppbv) in the headspace of the equilibrator. Below we discuss how to convert these mixing ratios to dissolved gas concentrations (nmol dm−3). Headspace equilibrator VOC mixing ratios are converted to nmol dm−3 using the ideal gas law as stated in Eq. (1):
where n (mol) represents the quantity of matter, V (dm3) represents the volume of gas, P (Pa) represents the pressure, R=8.314 m3 Pa K−1 mol−1, and T=293.15 K. A conversion factor of 0.001 is applied to convert from m3 to dm3.
The degree of equilibration for each gas in the SFCE was determined experimentally and is presented in Sect. 4.2. For compounds that fully equilibrate in the equilibrator, Eq. (2) is used to compute the measured dissolved gas concentrations:
where Cw(nmol dm−3) represents the dissolved gas concentration, Ca(ppbv) represents the measured headspace mixing ratio, (ppbv) represents the background mixing ratio (see Sect. 4.1), H represents the dimensionless liquid-over-gas form of Henry solubility (see Sect. 4.2.1), PF represents a purging factor (see the Supplement and Sect. 4.2.1), and a factor of 1.2 is applied to account for the dilution of these gases in the headspace of the equilibrator.
For compounds that partially equilibrate, the mean calibration curve estimated from liquid standards diluted in Milli-Q water (S; ppbv nmol−1 dm3) was used to determine measured dissolved gas concentrations after subtraction of the background:
This is more suitable than Eq. (2) as the Henry solubility and the purging factor do not apply for partially equilibrating gases. Technically, using a freshwater calibration curve to calculate gas concentrations in seawater will introduce an uncertainty (nominally within 10 %) due to the effect of salinity on gas solubility. Of all the VOCs studied here, the highly insoluble isoprene is the only one that does not completely equilibrate in the SFCE. The salting-out effect of isoprene seems small relative to the uncertainty in the isoprene calibration curves (Sect. 4.2.2) and is thus neglected here.
4.1 Estimation of backgrounds for seawater VOC measurements
The ideal background, or blank, for seawater VOC measurements would be VOC-free seawater. However, we have been unable to generate or obtain seawater that is free of methanol, acetone, or acetaldehyde due to the high solubility and ubiquity of these gases. Additionally, it is debatable whether any natural seawater may be free of methanol, acetone, or acetaldehyde as there is a lack of knowledge about the cycling of these compounds. The choice of background is most important for these soluble OVOCs as the ratio of background to signal can be quite high and the background can be variable. For example, for acetone the average signal-to-background ratio during the 3-week Arctic field campaign (Sect. 5) was 1.62 with a background standard deviation of 26 %. Below, we discuss three different approaches to estimating the background of seawater VOC measurements.
First, direct measurement of zero air (i.e. bypassing the SFCE) was used to track any drift in the internal PTR-MS background. This simple method of deriving a blank was also used by Yang et al. (2013b). This approach might not provide the most representative of backgrounds for all seawater VOCs because (i) zero air has a much lower humidity than the equilibrator headspace, and humidity could affect the backgrounds of some of the measured compounds (de Gouw and Warneke, 2007) (see the Supplement); and (ii) it does not account for any possible contamination within the equilibrator.
Second, at every sampling station, bottom water (i.e. the deepest water collected by the rosette, which was between 290 and 1700 m, well below the mixed layer) was measured. For some VOCs that are thought to be only produced in the surface ocean and rapidly consumed at depth (such as DMS), it might be expected that their concentrations in deep water would be close to zero. However, there is insufficient field data to know whether this is the case for all the VOCs monitored here. Measurements of methanol and acetone in the north Atlantic show that their concentrations do decrease below the mixed layer (Williams et al., 2004) but do not necessarily go to zero. Similarly, depth profile measurements showed acetone concentrations near the detection limit (0.3 nmol−1 dm3) at 200 m (Beale et al., 2013), while methanol and acetaldehyde concentrations at depth did not decrease as rapidly. We note that for these measurements a flow of dry nitrogen was used as a background, which may be an underestimation of the true system blank (see the Supplement). The chief advantage of using the bottom water measurement as the background is that these samples after equilibration have the same properties (humidity, temperature, exposure to the equilibrator, and collection protocol) as the surface water samples.
The final blank we determined was the “wet equilibrator” blank. This consisted of stopping the water flow into the equilibrator and purging the wet equilibrator (that had been coated with bottom seawater) with zero air for 20 min. During this blank measurement, humidity in the headspace remained constant as small water droplets remained inside the coil and were not substantially dried by the zero air. During the Arctic cruise, the wet equilibrator blank consistently resulted in the lowest reading on the PTR-MS for all VOCs except methanol and acetone (as a result of a contamination, which is discussed below). Thus, in practice the wet equilibrator blank seems to be the best surrogate for a “true” water blank for almost all VOCs measured here. During the wet equilibrator blank, the bottom of the PTFE jar contains approximately 5 mL of residual seawater that is not readily flushed out; in the case of the tee, there is essentially no residual seawater in the air–water separator. During normal seawater measurement, the residence time of zero air and seawater in the equilibrator is approximately 0.6 min. The residence time of zero air during a wet equilibrator blank measurement is about 1.2 min.
The 200 cm3 headspace jar used for separating the headspace from the seawater after equilibration is made from PTFE, which should be inert. However, we found that the empty equilibrator blanks of methanol and acetone were about 0.2 ppbv higher than their deepwater blanks during a cruise. The most plausible explanation for this seems to be outgassing or permeation of methanol and acetone through the walls of the PTFE jar itself, which is suppressed during the water measurement. During the 3-week field deployment, we observed a strong correlation between zero air and bottom water measurements (R2=0.92 methanol, R2=0.69 acetone), suggesting the concentrations of these VOCs at depth are either uniform or very small. Because of the contamination described above, we report seawater acetone and methanol concentrations from this cruise using bottom water as the background; these concentrations should thus be viewed as possible lower-limit estimates. After the cruise, we replaced the PTFE jar with a PTFE tee fitting (Swagelok) and this contamination greatly decreased.
We find that ultrapure Milli-Q water or bottom seawater water is typically free of the less soluble compounds such as DMS, toluene, benzene, and isoprene. This is confirmed by good agreement between the wet equilibrator blanks and the Milli-Q and bottom seawater measurements. This agreement also suggests that our system is not affecting the measured concentrations of these compounds through cell rupturing. The concentrations of methanol, acetone, and acetaldehyde measured in the Milli-Q water during the Arctic cruise were much higher than those in seawater and were highly variable (see the Supplement). Similarly, we found that tap water or bottled drinking water is typically not free of methanol, acetone, and acetaldehyde, likely due to slow leakage of these compounds from the pipes, tubes, and/or containers.
4.2 Estimation of equilibration efficiency
4.2.1 Experimental setup
As a brief recap, for gases that appear to fully equilibrate in the SFCE, seawater concentrations (Cw) are computed from the equilibrator headspace mixing ratio (Ca) using the dimensionless air-over-water Henry solubility constant (H) (Sander, 2015). Headspace equilibrator mixing ratios are converted from ppbv to nmol dm−3 using the ideal gas law, and the dilution of equilibrator headspace is accounted for by multiplying measured equilibrator mixing ratios by 1.2 (Sect. 3, Eq. 2).
Where possible, values for Henry solubility recommended by Burkholder et al. (2015) were used for this calculation as those were deemed most reliable. These values represent freshwater solubilities and are converted to seawater solubilities by accounting for salting-out effects (Johnson, 2010). Values of the dimensionless Henry solubility (water over gas) in freshwater and seawater as well as the references for the solubility are displayed in Table 1.
Table 1Dimensionless Henry solubility values (water over gas) in freshwater and seawater used to compute dissolved gas concentrations.

Two methods are used to assess the equilibration efficiency of the SFCE: evasion and invasion. In evasion experiments, liquid standards of methanol, acetone, and acetaldehyde were prepared by serial dilution of the pure solvent in the same batch of Milli-Q water. Aliquots of pure, undiluted methanol (Uvasol for spectroscopy) and acetone (high-performance liquid chromatography standard) were dispensed using volumetric pipettes. A 1 cm3 volumetric flask was used to aliquot pure acetaldehyde ( %, ACS Reagent). Subsequent dilutions utilised a volumetric pipette and volumetric flask to prepare liquid standards ranging from 3 to 30 nmol−1 dm3 for acetone and acetaldehyde and 30 to 300 nmol−1 dm3 for methanol. Liquid standards of isoprene and DMS were prepared gravimetrically airtight each day. A syringe pump (New Era Pump Systems) was used to dynamically dilute DMS and isoprene standards in a flow of Milli-Q water. This yielded DMS standards of up to 7 nmol−1 dm3 and isoprene standards of up to 2 nmol−1 dm3. For this calibration, the flow rate of Milli-Q water is measured at the drain. In evasion calibrations, a solubility-dependent fraction of dissolved VOCs is transferred into the gas phase during the equilibration process. Thus, the final dissolved concentration will be somewhat lower than the initial concentrations. To account for the removal of the fractions of these gases from the seawater during equilibration, a purging factor (PF) based on mass conservation is applied. The PF is the ratio between the dissolved gas concentration before and after complete equilibration in the coil. The derivation of this compound-specific purging factor is presented in the Supplement. At equal airflow and water flow rates, it simplifies to
The precision of the purging factor depends on the precision of the solubility measurement. Since solubilities are reported in this paper to two significant figures, the purging factor is reported here to two significant figures as well. For freshwater, computed purging factors assuming full equilibration and equal zero airflow and water flows are 1.00 for methanol, 1.00 for acetone, 1.00 for acetaldehyde, 1.06 for DMS, 1.18 for benzene, 1.21 for toluene, and 2.57 for isoprene. The same computation in seawater gives the following purging factors: 1.00 for methanol, 1.00 for acetone, 1.00 for acetaldehyde, 1.08 for DMS, 1.22 for benzene, 1.26 for toluene, and 2.96 for isoprene. We see that PF varies from being insignificant (with a value of 1) for highly soluble VOCs to quite large (≫1) for the sparingly soluble gases. To compute the expected headspace mixing ratio during the evasion calibrations assuming full equilibration, the known waterside concentrations are divided by the purging factor. Then the equilibration efficiency is calculated as the measured headspace mixing ratio divided by the expected headspace mixing ratio assuming full equilibration.
We also tested the absorption of gaseous VOCs into the water phase (i.e. invasion). This is especially useful for gases such as benzene and toluene, as we were unable to use liquid standards for these compounds due to their toxicity. During invasion experiments, a flow of VOC gas standard was diluted to varying degrees with VOC-free zero air using mass-flow controllers. This diluted VOC gas standard was then equilibrated with essentially VOC-free Milli-Q water. The assumption of no VOCs in the initial water is reasonable as we used relatively high carrier gas VOC mixing ratios (up to 50 ppbv) and the Milli-Q water is essentially free of DMS, benzene, toluene, and isoprene (Sect. 4.1). The headspace equilibrator mixing ratio is measured and compared to the expected mixing ratio at full equilibration. Calculation of the expected mixing ratios at full equilibration during invasion experiments is presented in the Supplement. For invasion experiments, the equilibration efficiency is calculated as the observed change in mixing ratio over the expected change in mixing ratio.
Ideally, we want to maintain a stable equilibration efficiency of 100 %. This would maximise the signal-to-noise ratio and minimise the measurement uncertainty. This may also reduce the need for frequent calibrations. Robust SFCE calibrations were not performed during the field testing presented here due to logistical constraints. Post-cruise calibrations were carried out on an approximately weekly basis over several weeks, intended to be representative of the duration of the cruise. These calibrations were used to assess the equilibration efficiency of SFCE and uncertainties therein.
4.2.2 Equilibration efficiency of DMS and isoprene
Prior experimentations with a similar setup suggest that the 10 m segmented flow tube presented here is at least a factor of 2 longer than required for full equilibration of DMS (Blomquist et al., 2017). Hence, we expect the soluble VOCs (methanol, acetone, acetaldehyde, DMS) to fully equilibrate due to their higher solubility (Liss and Slater, 1974). Figure 2 shows calibration curves for DMS and isoprene using liquid standards (i.e. evasion) over several weeks. The calibration curve for DMS suggests full equilibration (Fig. 2a); a ∼5 % underestimation of DMS in the mean is within the uncertainty of the solubility. The DMS calibration curves show very little noise and low weekly variability (±4 % SD), suggesting that the SFCE-PTR-MS setup is very stable. The calibration curve for isoprene suggests 62 % equilibration efficiency (Fig. 2b). A greater variability on a weekly basis (±14 % SD) is observed in the isoprene calibration curves, likely due to incomplete (and hence less consistent) equilibration.
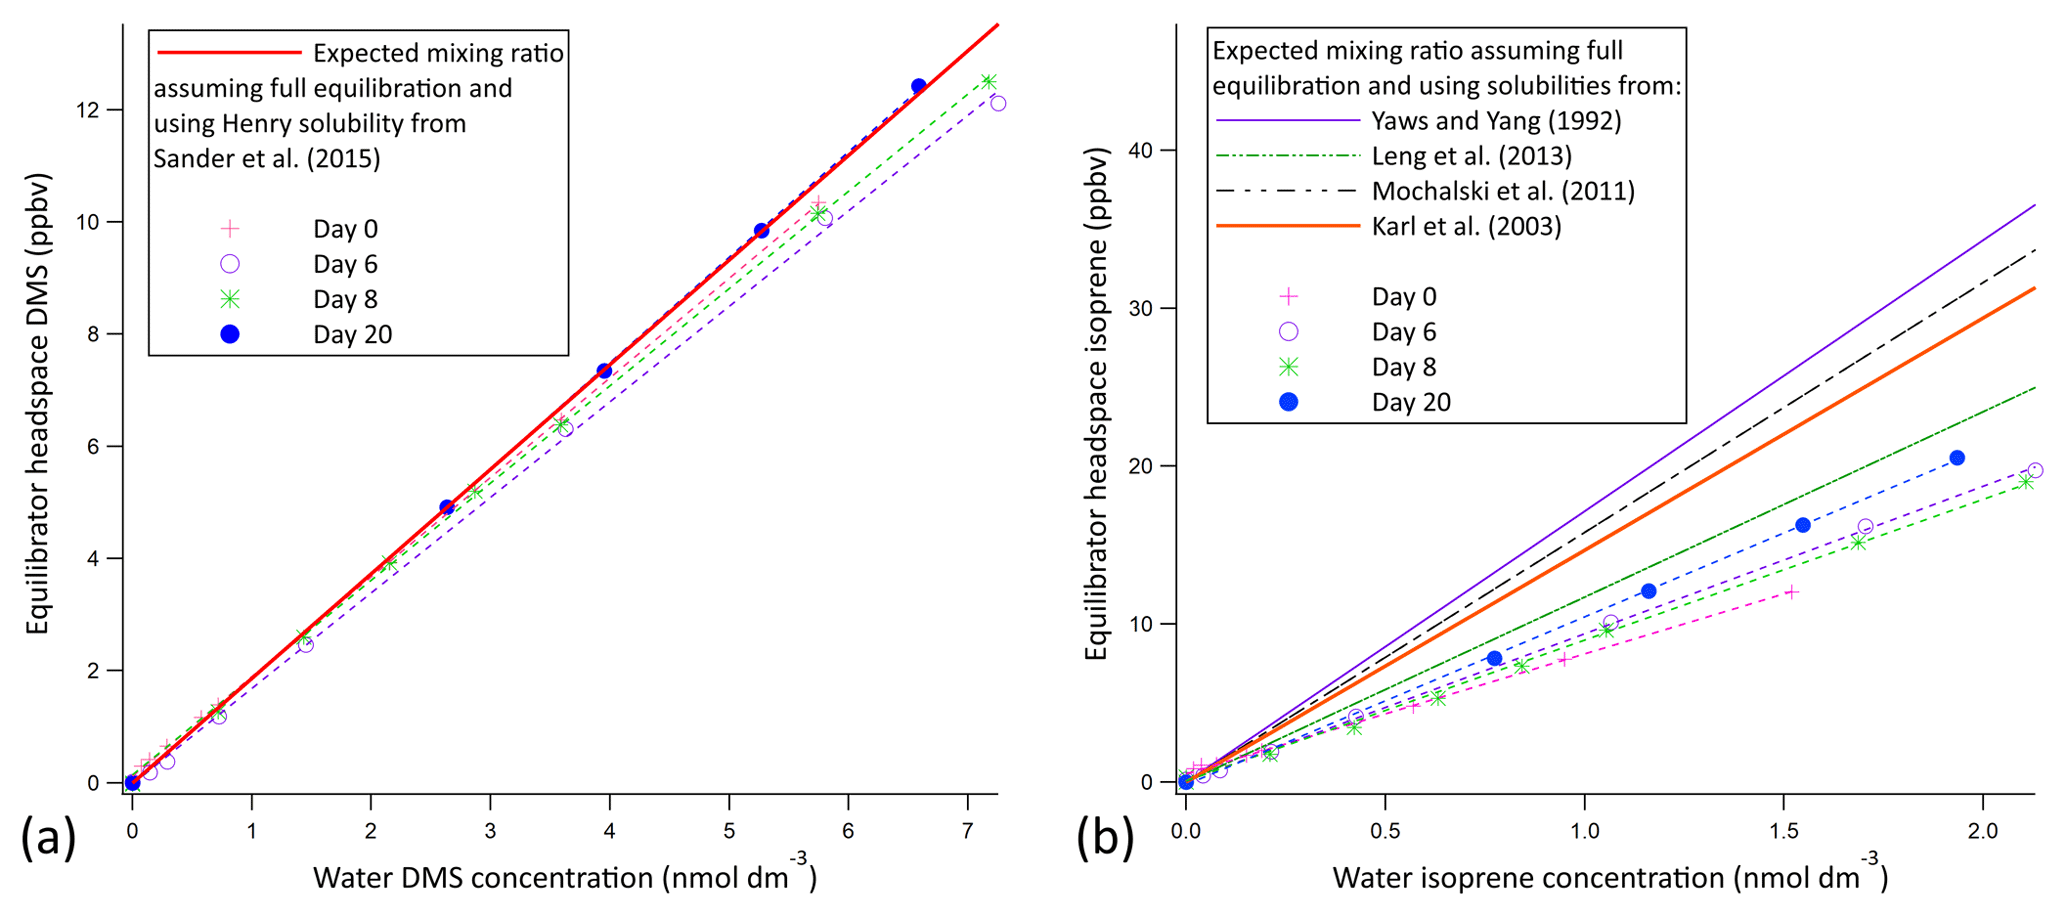
Figure 2Evasion calibration curves for DMS (a) and isoprene (b). The average slope of the experimental calibration curve was found to be 1.77 ppbv nmol 1 dm3 ±4 % and 9.12 ppbv nmol 1 dm3 ±14 % for DMS and isoprene, respectively; errors represent the standard deviation over a 3-week period. The full equilibration slope was computed to be 1.87 ppbv (nmol dm−3)−1 and 14.69 ppbv (nmol 1 dm−3)−1 for DMS and isoprene, respectively (using Burkholder et al., 2015, for DMS solubility and Karl et al., 2003, solubility with Leng et al., 2013, temperature dependence). This suggests approximately 100 % and 62 % equilibration efficiency for DMS and isoprene, respectively. Error bars are too small to display, but the noise associated with the measurement was found to be 0.0069 and 0.00058 ppbv for DMS and isoprene, respectively. This was calculated as the SD of 10 consecutive water blank measurements.
Results from the invasion experiments are displayed in Fig. 3 and confirmed that the equilibrator fully equilibrates for DMS, as the measured and expected gas-phase mixing ratios of DMS match. The equilibration efficiencies of the less soluble gases benzene and toluene were found to be 94±1 % and 95±2 %, respectively. The 5 % difference is within the uncertainty of the solubility of these compounds, and hence for the computation of seawater concentrations we assume that these compounds fully equilibrate. This invasion experiment was also performed for the highly soluble OVOCs (methanol, acetone, and acetaldehyde). These gases were found to be entirely absorbed into the water phase, essentially leading to noise in the measurements of headspace mixing ratios.
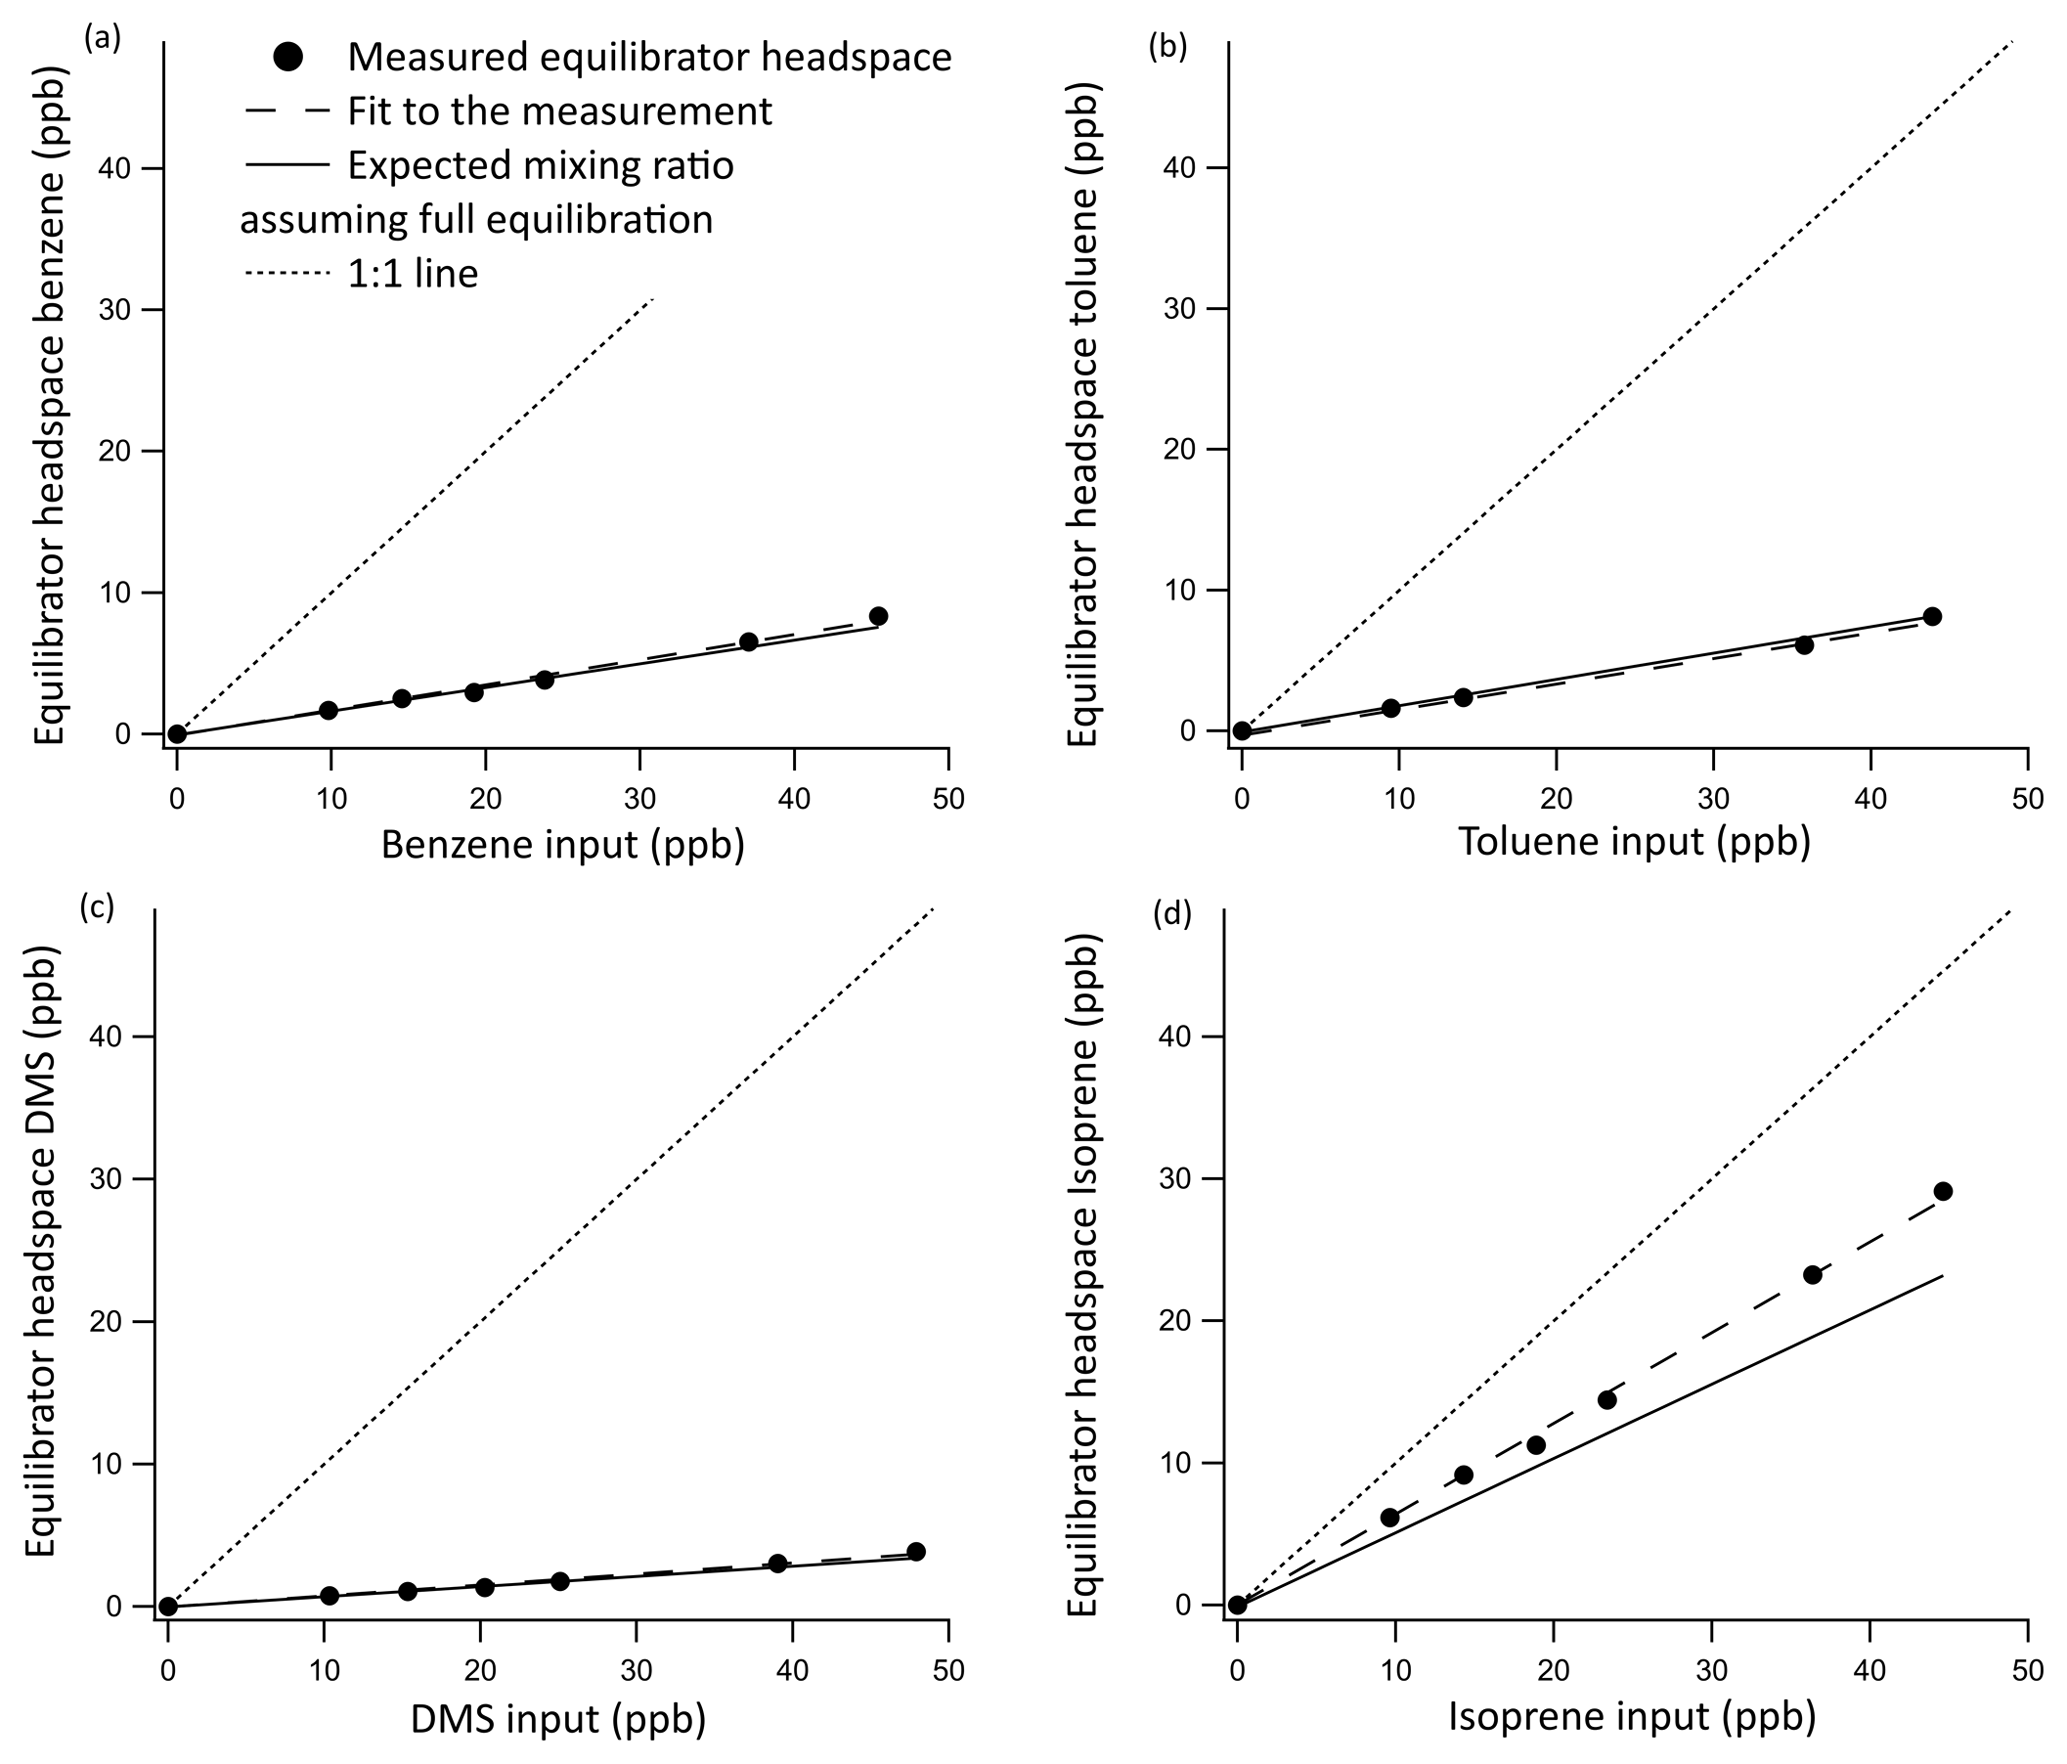
Figure 3Invasion calibration curves for benzene (a), toluene (b), DMS (c), and isoprene (d) for which a known amount of standard gas is added to the zero air carrier gas while measuring VOC-free Milli-Q water. Error bars were too small to display, but the noise associated with the measurement was found to be 0.0069 and 0.00058 ppbv for DMS and isoprene, respectively, and 0.043 and 0.042 ppbv for benzene and toluene, respectively. This was calculated as the SD of 10 consecutive water blank measurements. A 1:1 line is included to illustrate the role of the water phase in absorbing these compounds.
The equilibration efficiency of isoprene (the least soluble compound that we measure by far) of 69 % from invasion is similar to that determined in the evasion experiments (62 %) if we use the isoprene solubility from Karl et al. (2003) and the temperature dependence from Leng et al. (2013). We note that there is a large range in the values for isoprene solubility in the literature. Using the solubility values from Yaws and Yang (1992), Leng et al. (2013), or Mochalski et al. (2011) would result in a large and unexpected discrepancy in the equilibration efficiency of isoprene between the evasion and invasion experiments.
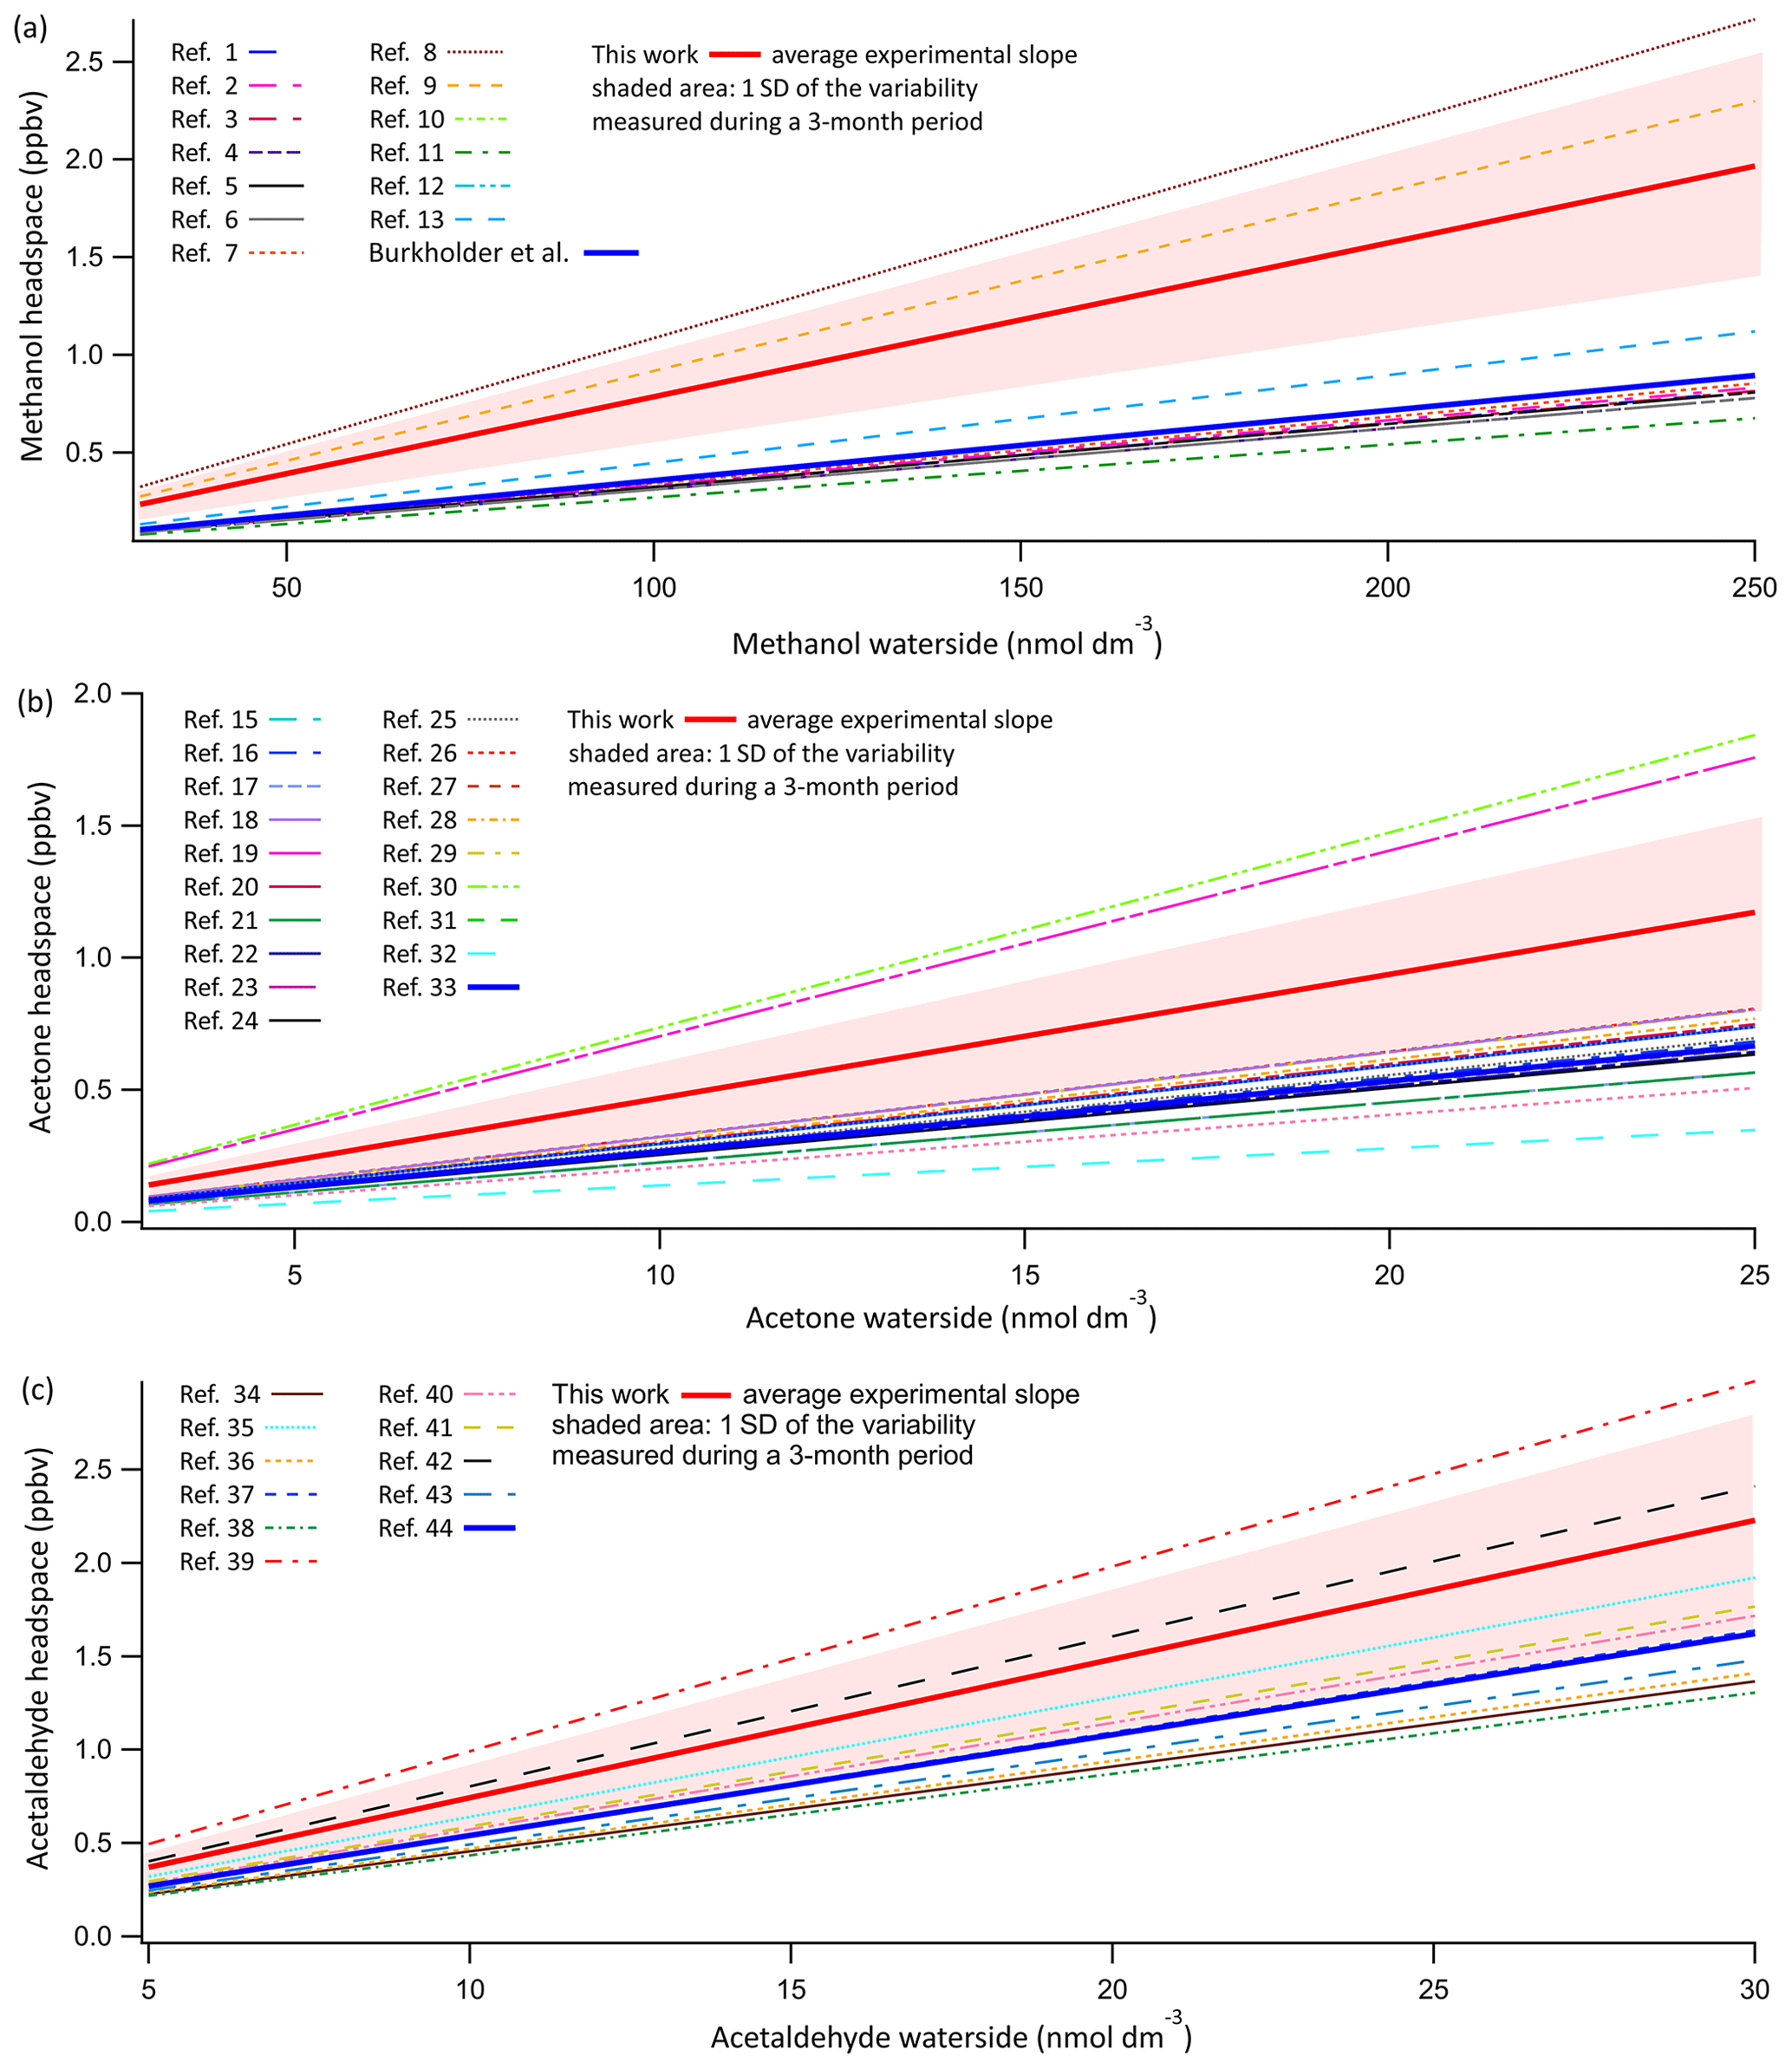
Figure 4Evasion calibrations of OVOCs. Displayed are the average experimentally determined slopes of 14 calibration curves of methanol (a) and acetone (b) and 11 calibration curves of acetaldehyde (c). These calibrations suggest possibly lower solubility of these compounds compared to literature values. Shaded area indicates 1σ standard deviation of the variance in the slope during this 3-month period. Average experimentally determined calibration slopes for methanol, acetone, and acetaldehyde were 0.00786±0.00115, 0.0469±0.0145, and 0.0743±0.0190 ppbv nmol−1 dm3. Plotted along this are the predicted slopes using all experimentally determined solubilities as listed in Sander (2015). The recommended solubility by Burkholder et al. (2015) is plotted as a solid thick line in dark blue. The key to the figure is listed in a table in the Supplement, listing the in-figure reference followed by the dimensionless water-over-air Henry solubility in Milli-Q water at 20 ∘C and the predicted slope using the listed experimentally determined solubility. For full references of the cited solubilities, please refer to Sander (2015).
4.2.3 Equilibration efficiency of OVOCs
Both theoretical considerations (e.g. Liss and Slater, 1974) and experiments with a varying airflow : water flow ratio (Sect. 4.25) indicate that the OVOCs should fully equilibrate within the SFCE. The average slope of 11 calibration curves for acetaldehyde and 14 calibration curves for methanol and acetone over a 3-month period are shown in Fig. 4. Results are compared to the expected mixing ratio computed using every experimentally determined solubility listed in the compilation by Sander (2015). The measurements are also compared to the solubility recommended by Burkholder et al. (2015), which was chosen as a critical synthesis of published solubilities.
The experimentally determined calibration slopes for OVOCs are linear (typical R2 above 0.95). However, they are on average about 1.5 times higher than the solubilities recommended by Burkholder et al. (2015). Nevertheless, these experimental mean slopes are within the range of published solubility values. The relative standard deviation associated with the OVOC calibration curves (∼25 %) is much larger than that in the DMS calibration curves (4 %), with the latter an indication for the stability of the PTR-MS–equilibrator system. On a weekly basis, the calibration curves of individual OVOCs correlate with each other, and these OVOCs were diluted together from pure reagents. This suggests that most of the observed variability in OVOC calibration from week to week might be due to errors or contamination in the serial dilution procedure. In order to ensure consistency with previous equilibrator setups (Kameyama et al., 2010), in this paper we report our dissolved gas concentrations using the recommended solubilities from Burkholder et al. (2015). Using the mean of our experimental dissolved gas calibrations would decrease the computed OVOC seawater concentrations by approximately 50 %.
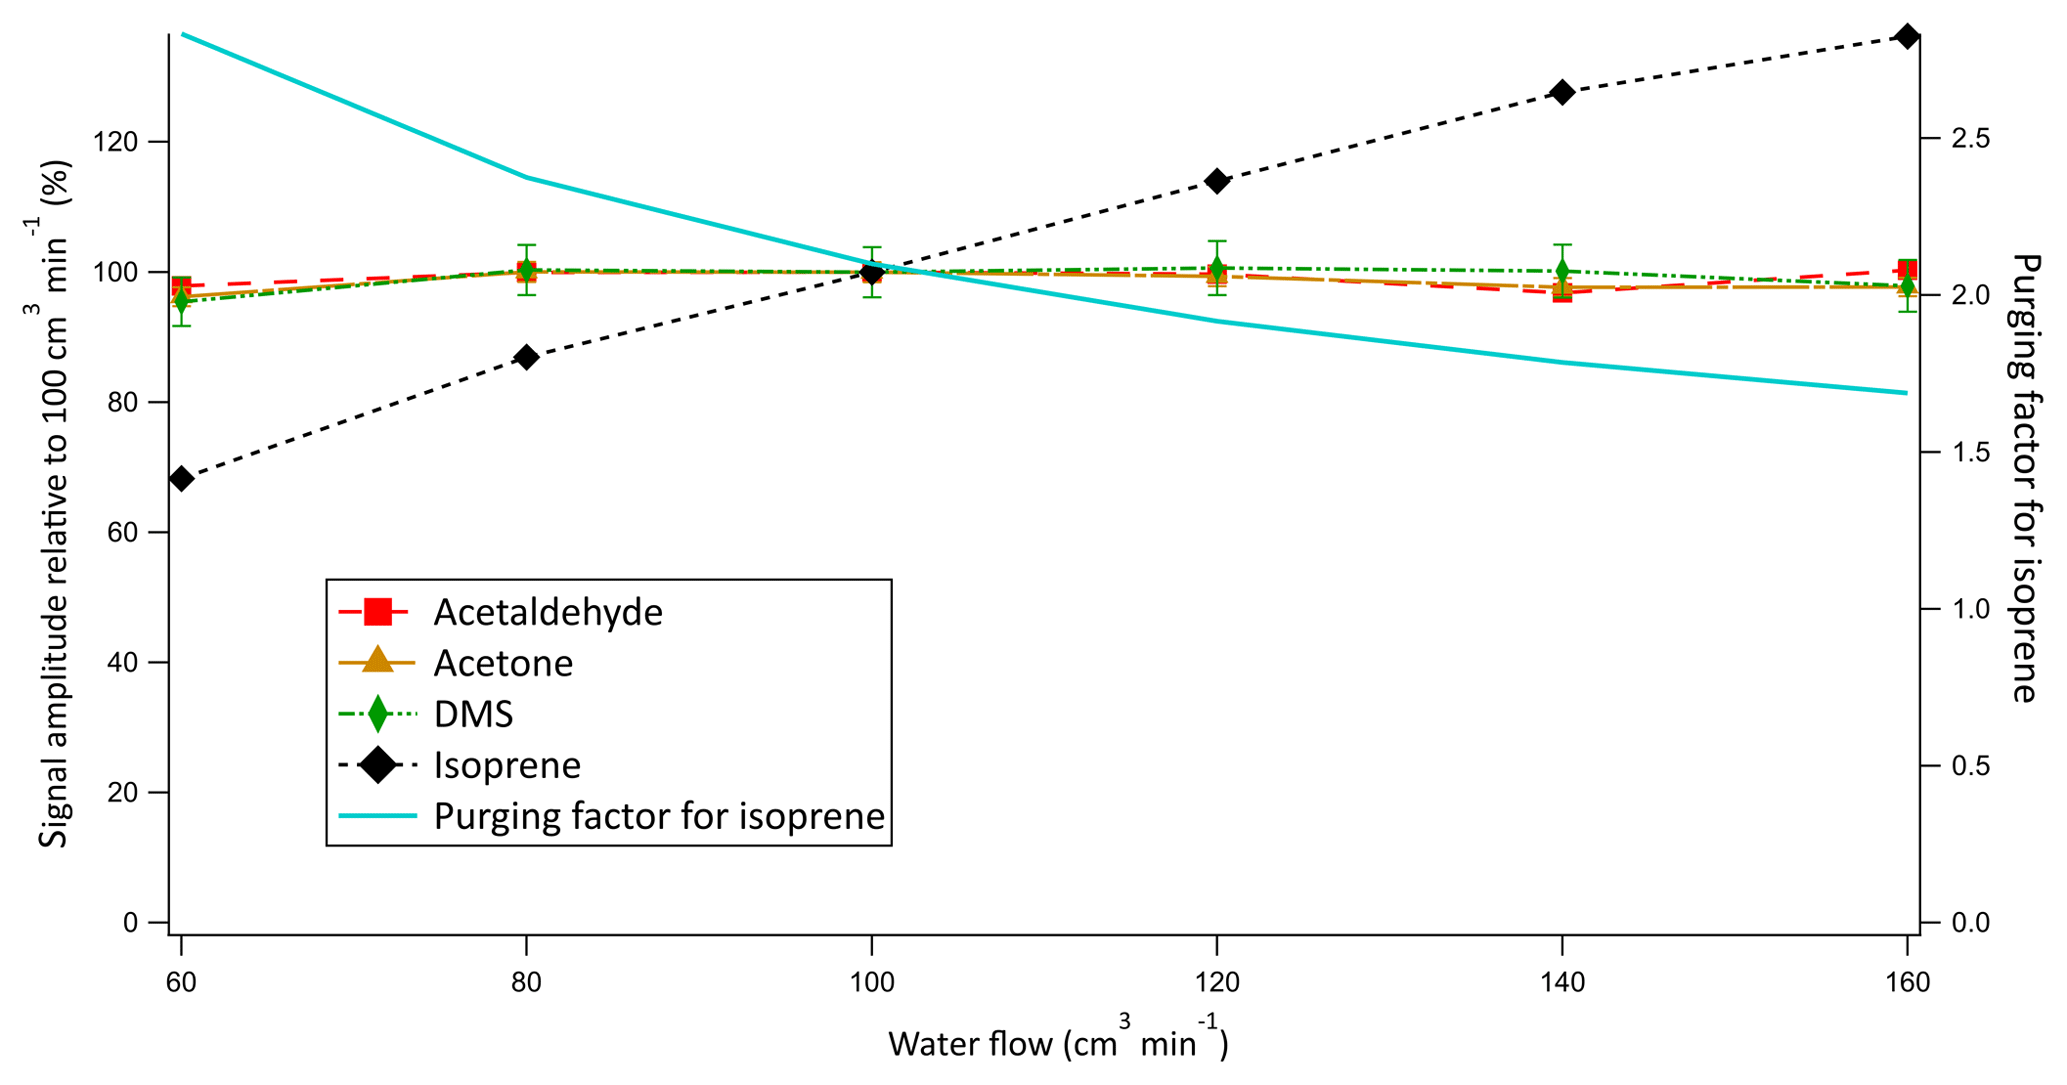
Figure 5Relative signal as a function of water flow into the equilibrator. Error bars represent random error propagation with the initial error determined from the standard deviation of 10 consecutive 6 min blank measurements.
4.2.4 Measurement sensitivity toward airflow : water flow ratio
Air and water at equal flow rates of 100 cm3 at 20 ∘C were chosen to allow for a sufficiently long equilibration time, large surface area for exchange, and high signal while satisfying the airflow requirements of the PTR-MS. They were also chosen such that the stripping of the soluble compounds from the water phase during equilibration would be small (i.e. purging factor near 1). Additionally, the use of equal flows of air and water simplifies the calculation of dissolved gas concentrations. The water flow was not routinely monitored during the Arctic deployment and decreased by up to 20 % due to ageing of the peristaltic pump tubing. This could influence our measurement through at least (i) the equilibration time and hence the efficiency in the coil as well as (ii) the purging factor. To investigate the influence of these competing factors on the signal, an experiment was performed after the cruise measuring the same solution of liquid standard at different water flows into the equilibrator while keeping the airflow constant (Fig. 5).
The signals of acetone, acetaldehyde, and DMS were found to be independent of the water flow into the equilibrator. These results provide strong experimental evidence that (i) VOCs with solubilities greater than or similar to DMS do equilibrate in the coil, and (ii) the gas flow does not remove a large fraction of these gases from the water phase during the equilibration process (i.e. purging). In contrast, the signal of isoprene was found to decline with decreasing water flow. As the water flow is decreased during this experiment, the purging factor increased at a comparable rate to the decrease in the isoprene headspace mixing ratios. This suggests that the change in purging factor is largely responsible for the change in the isoprene signal (Fig. 5). Consequently, compared to the soluble VOCs, for isoprene there is an additional uncertainty of ∼20 % that is due to the variable water flow during the cruise (see Sect. 4.4).
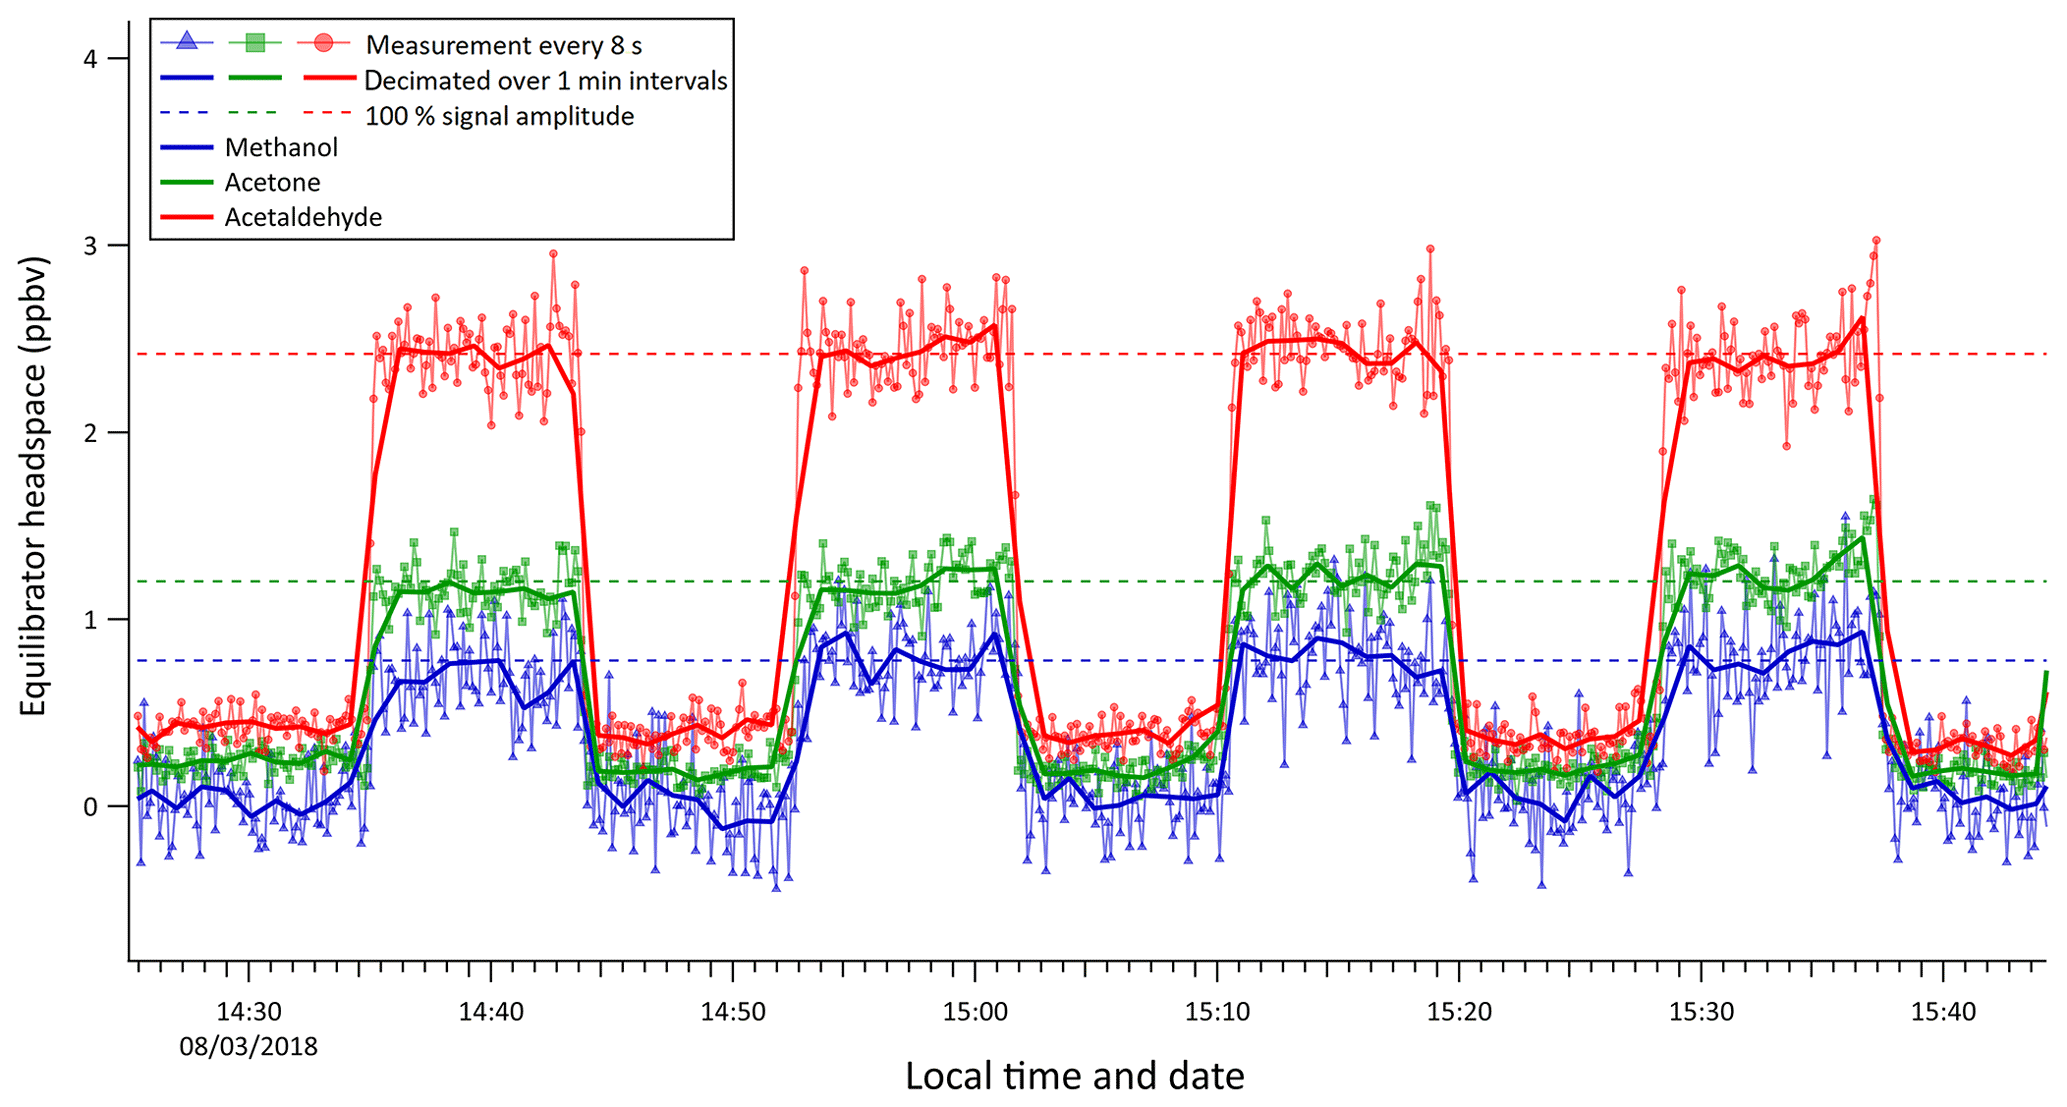
Figure 6Instrument response to step changes in Milli-Q water OVOC concentration (step size: 20 nmol dm−3 acetone, 20 nmol dm−3 acetaldehyde, 200 nmol dm−3 methanol).
4.3 Measurement response time
A series of liquid standards containing 20 nmol dm−3 acetone, 20 nmol dm−3 acetaldehyde, and 200 nmol dm−3 methanol (Fig. 6) were analysed in order to determine the response and delay time of the equilibrator and to test for any possible memory effect due to wall adsorption and desorption effects. Discrete samples were swapped over rapidly and the water flow into the equilibrator was stopped briefly to avoid interference with the measurement.
The residence time (0.6 min) in the equilibrator segmented flow tube was calculated from the flow of air and water into the equilibrator and the volume of the segmented flow tube. The response time (e-folding time) of the equilibrator response to the step change was estimated using the 8 s PTR-MS measurements to be 35, 33, and 33 s for methanol, acetone, and acetaldehyde, respectively. Thus, the response time appears to be independent of the solubility and comparable to the residence time in the SFCE. The rapid rate of increase and decrease in OVOC concentrations during this experiment also suggests that there was little “carry over” or memory effect. Whilst the response time of the SFCE is less than 1 min, measured equilibrator headspace mixing ratios are typically averaged over 6 min for both underway measurements and discrete measurements to reduce random noise and improve the precision of the measurement.
4.4 Measurement precision and limit of detection
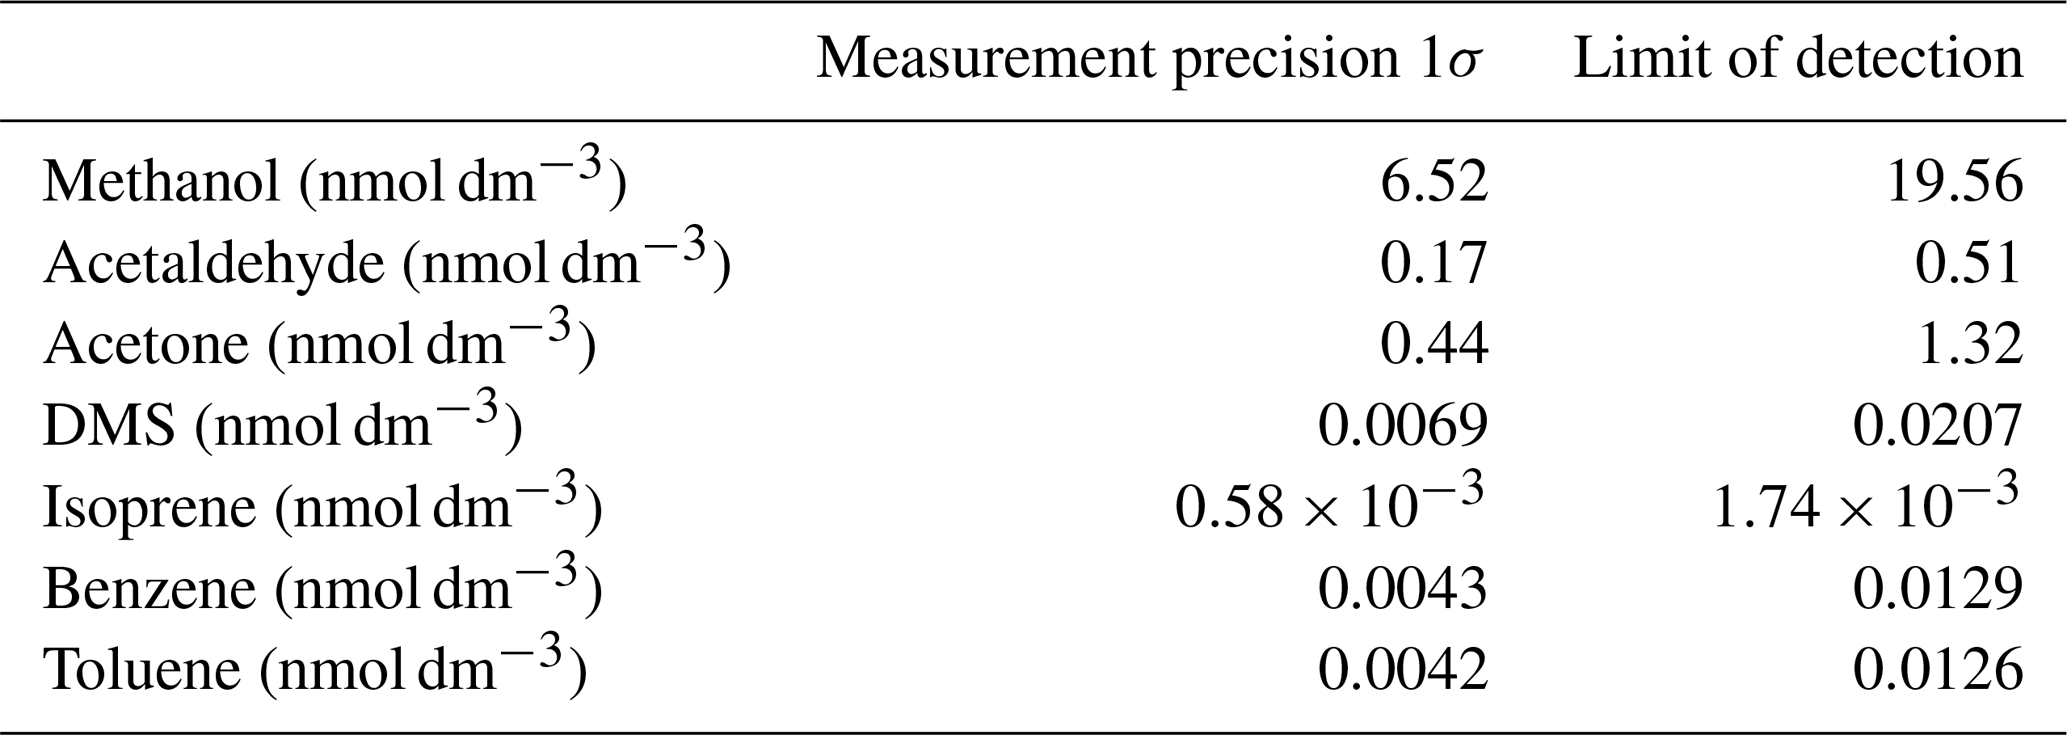
The analytical precision and the limit of detection (LOD) of this system are partly dictated by the noise of the PTR-MS measurement. This in turn depends on the dwell time of the detector at a given mass and thus the time the data are averaged over. Additionally, the measurement precision strongly depends on the gas solubility. For isoprene, the analytical precision additionally depends on the variability in water flow. We compute the analytical precision as the standard deviation (1σ) of 10 consecutive 6 min wet equilibrator blank measurements, which is then converted to a dissolved gas concentration using Eq. (3) for isoprene and Eq. (2) for the other VOCs. The precision is therefore averaged over 70 measurement cycles with a dwell time at each mass of 500 ms, giving an effective dwell time of 35 s. The LOD is defined as 3 σ. The resulting measurement noise and limit of detection for each compound are displayed in Table 2 for 6 min averaged data. These values should approximately halve if the data are averaged over 30 min intervals instead.
Table 2Analytical precision and limit of detection of the seawater VOC measurements.
In the case of typically 900 mL discrete samples (see Sect. 5), the measurement time is limited by the water flow rate. A larger water volume may improve the analytical precision by allowing for a longer sampling and averaging time. This is especially relevant for the most soluble compounds, including methanol and acetone.
The SFCE coupled to PTR-MS has been field tested on a 3-week research cruise in the Canadian Arctic. Underway surface water and depth profiles were measured on board the icebreaker CCGS Amundsen from mid-July until the beginning of August 2017. The ship travelled from Iqaluit to Smith Sound and ended near Resolute (cruise-track map in the Supplement). For underway measurements, seawater from the ship's pumped seawater supply was continuously piped into an open-topped PTFE beaker fixed in the sink and allowed to overflow. The seawater was pulled by the peristaltic pump into the SFCE from the bottom of this beaker. This setup buffered pressure variations and hence variable flow rates in the underway water supply, which could have affected instrument response (Sect. 4.2.4). The open-topped beaker also allowed marine debris to overflow rather than clogging the SFCE intake. Since there are no membranes, small particles that do enter the SFCE simply pass through the 4 mm inner diameter tube and are drained away.
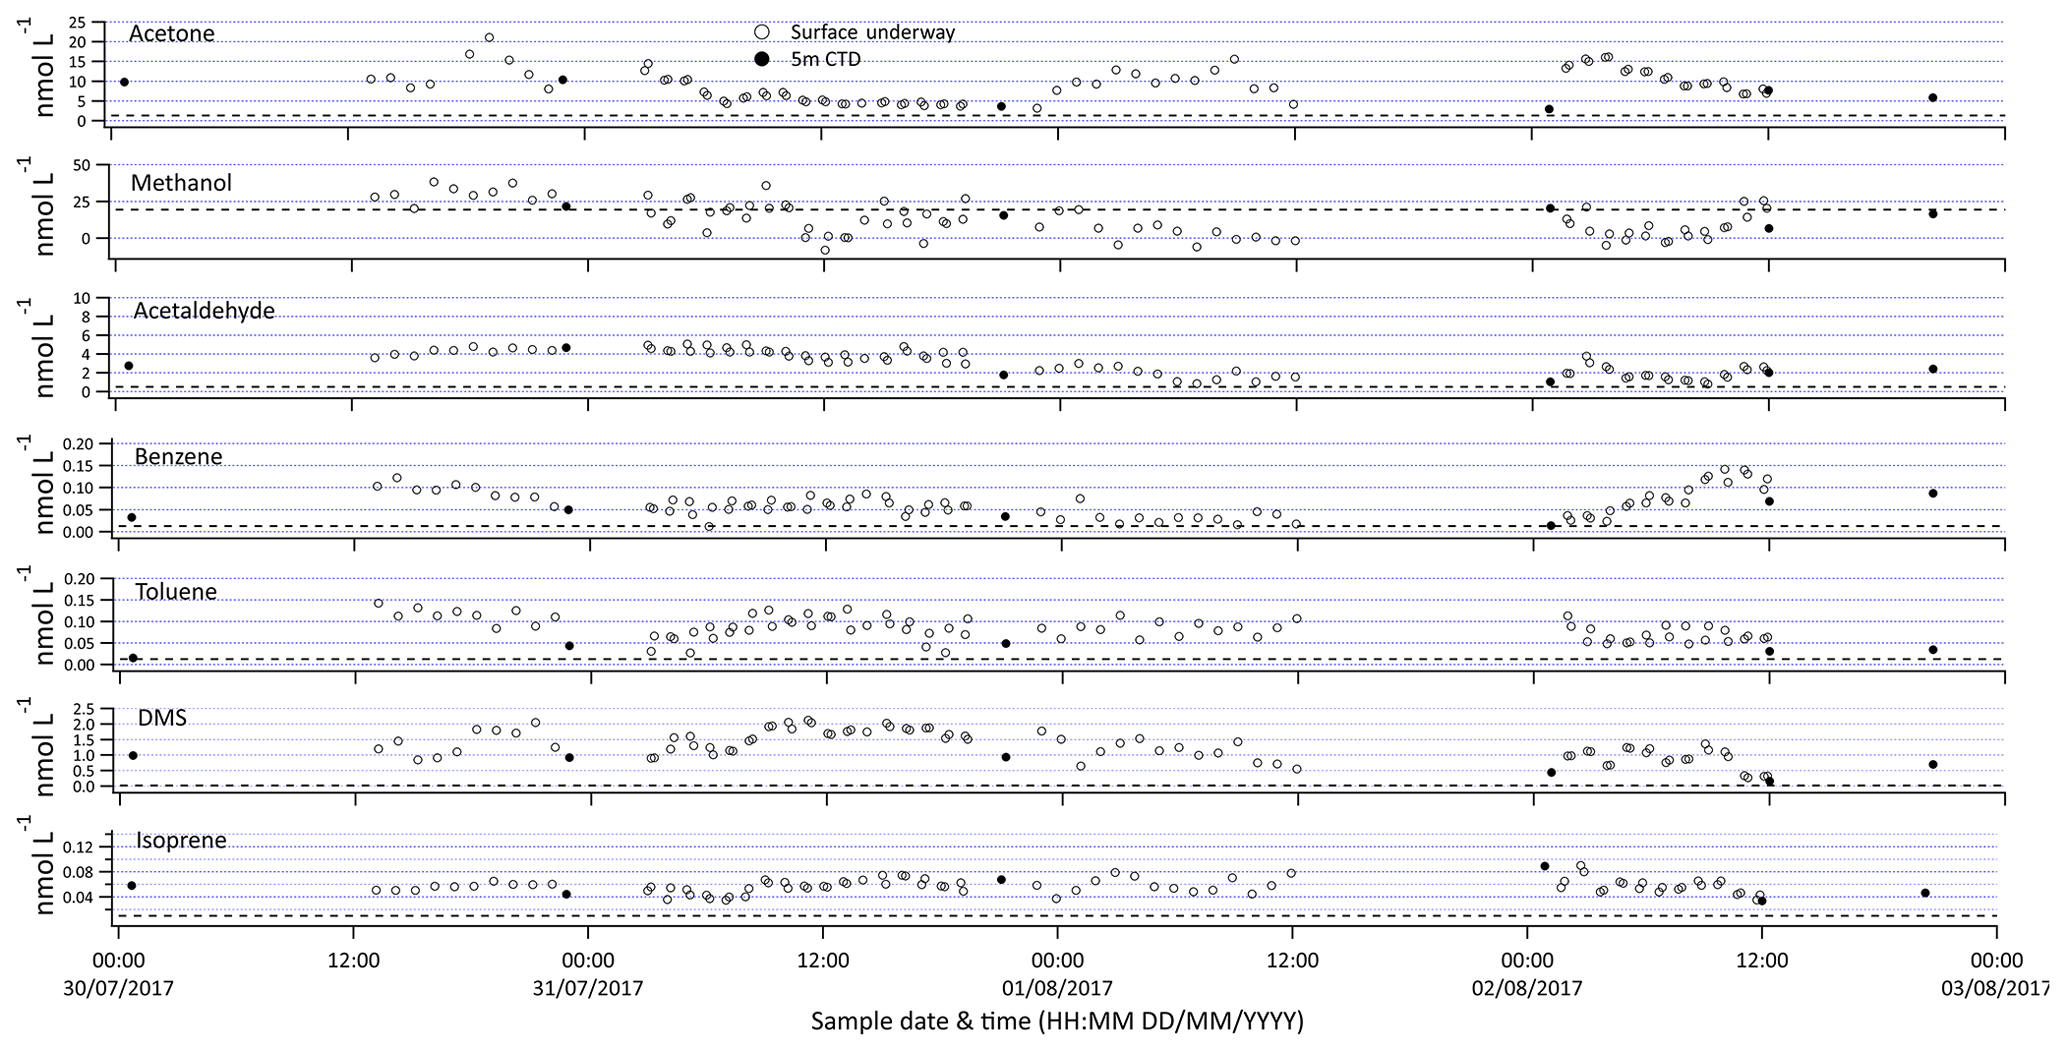
Figure 7Selection of VOC measurements made from the ship's built-in underway surface water supply (open symbols) and discrete samples from 5 m rosette (closed symbols). The dotted line represents the limit of detection.
Discrete water samples from the ship's rosette were collected in 900 cm3 ground-glass-stoppered sample bottles using Tygon tubing. Sample bottles were rinsed three times and overfilled without introducing bubbles to avoid air contamination. To measure discrete samples, the underway measurement was stopped, and the PTFE water intake tube was simply moved from the seawater intake to each sample bottle (water flow stopped during changeover). Water was pumped from the bottom of the 900 cm3 sample bottles, while minimising agitation. The top 5 cm of the discrete water sample was not measured because of the possibility of air contamination. The sampling time per bottle was under 9 min. The analysis of about eight discrete samples is typically finished within 2 h of sample collection. This should be fast enough to avoid sample degradation of even the most reactive VOCs (Beale et al., 2011).
The SFCE coupled to PTR-MS allows for continuous measurement of a breadth of VOCs at a high resolution. Sample data presented in Fig. 7 contain 5 min measurements that are further averaged to hourly intervals. The underway surface water measurements capture a larger range of concentrations (e.g. acetone 3.5–23 nmol dm−3) than discrete surface samples collected from the ship's rosette (e.g. acetone 2.9–10 nmol dm−3). This highlights one of the benefits of underway measurements, as some of these compounds display noticeable fine-scale variability, likely due to their short lifetime.
Table 3Average concentration measured for each compound from the 5 m Niskin bottle and 3 h either side of the Niskin measurement from the ship's built-in underway water inlet. Errors represent the 95 % confidence interval of this average.

Contamination of the underway water supply relative to the conductivity–temperature–depth (CTD) Niskin bottle has been observed for acetone (Yang et al., 2014), probably due to the ubiquity of OVOCs and their wide application in shipboard science (e.g. acetone for chlorophyll extraction). Previous underway measurements of isoprene and DMS have revealed that after switching the underway water supply on, the first few hours of data typically showed significantly higher concentrations (Andrews et al., 2015). To verify that the seawater supplied by the ship's underway water supply is uncontaminated, at every station the CTD Niskin bottle from 5 m of depth was sampled. In this particular dataset, underway measurements and discrete samples from 5 m of depth do not show any obvious difference for most of the VOCs. This is confirmed by the fact that the average concentration reported from the 5 m Niskin bottle (±95 % confidence interval of the mean) overlaps the average concentration measured from the ship's built-in underway water inlet 3 h either side of the CTD measurement (Table 3). Measurements below the limit of detection were included for all analyses to avoid a biased mean. The DMS and toluene concentrations from the underway water inlet do appear to be higher compared to measurements from the 5 m Niskin bottle. This could be due to contamination of the underway water supply or perhaps due to differences in sample depths between the underway and CTD measurements. Strong vertical gradients were observed near the surface for most of the VOCs, which will be discussed in more detail in a future paper. The data presented here are preliminary and have not been corrected for this possible contamination.
This paper presents a ship-based equilibrator system coupled to a PTR-MS for measurements of a wide range of VOCs in seawater. Its main advantage lies in its unique design. The segmented flow gives a high degree of equilibration due to surface renewal within each water segment (Xie et al., 2001), a large surface area for gas exchange, and sufficient equilibration time. It was found that with a 10 m segmented flow tube, the SFCE fully equilibrates for gases of similar or higher solubility than toluene. The unique air–water separation system allows for rapid drainage of water without droplet formation, thus yielding a high response time of less than 1 min even for the highly soluble OVOCs. Additionally, the SFCE can be used for underway and discrete sampling due to the ease of changing the water intake and low-water-flow requirements (100 cm3 min−1). Since it consists entirely of commercially available PTFE tubing, it can be easily and relatively cheaply constructed and should have minimal wall adsorption effects. The smooth surfaces and constant water flow make the equilibrator easy to clean and fairly resistant to biofouling. Finally, the SFCE system is designed with multiple fail-safes such that the failure of an individual component does not cause the equilibrator or detector to flood or over- or under-pressurise.
The equilibrator can be used to measure compounds that only partially equilibrate (e.g. isoprene) but with slightly higher uncertainty than for fully equilibrating compounds. The SFCE could easily be optimised for measuring these less soluble gases by making the segmented flow tube longer to allow more time for equilibration or by adding an isotopically labelled standard. One of the considerations when measuring dissolved gases with PTR-MS is the effect of humidity on the signal. A discussion is presented on how to estimate the background of the water measurement and how to correct for the effect of humidity on the PTR-MS signal (see the Supplement). Further work is being conducted to identify a more robust estimate for OVOC background that does not require deep seawater samples.
The SFCE-PTR-MS was used to measure methanol, acetone, acetaldehyde, DMS, isoprene, benzene, and toluene on board the Canadian icebreaker CCGS Amundsen during the Arctic spring in 2017. A selection of the underway measurements is presented here with a comparison to samples obtained from 5 m Niskin bottles.
We envisage wide applications of this novel equilibrator such as deployment on further research cruises for measurement of a wide range of gases. The SFCE could be coupled to other gas-phase detectors such as a CIMS (Saltzman et al., 2009) and/or incorporated into existing methods that require fast response times, for example near-surface ocean profilers (Sims et al., 2017).
Data used in this paper were acquired during method development and are not currently archived in a data repository. Please contact us if you are interested in the data.
The supplement related to this article is available online at: https://doi.org/10.5194/os-15-925-2019-supplement.
CW and MY designed the equilibrator. CW carried out system performance tests. PDN, AJ, DC, and WTS provided input on the method development. CW carried out the deployment on board with help from MY during installation. Collaboration with BGTE made these measurements in the Canadian Arctic possible. CW prepared the paper with contributions from all co-authors.
The authors declare that they have no conflict of interest.
Thanks a lot to R. Beale for her help during the early stages of the method development. Many thanks to Mohammed Ahmed and Brian Butterworth (University of Calgary) for their invaluable help during the field deployment. Many thanks to Douglas Collins (University of Toronto) for shipping the chemicals to port and Johnathan Abbat (University of Toronto) for providing a gas calibration standard. Further thanks to Frankie Hopkins and Thomas Bell for their demonstrations on how to prepare the DMS liquid standards. Thanks to the crew and the chief scientists on board the CCGS Amundsen, namely Martine Lizotte and Jean-Éric Tremblay, for accommodating this work.
This research has been supported by NERC EnvEast DTP (grant no. NE/L002582/1) and the UK Department for Business, Energy and Industrial Strategy (United Kingdom & Canada Arctic Partnership: 2017 Bursaries Programme).
This paper was edited by Mario Hoppema and reviewed by two anonymous referees.
Andrews, S. J., Hackenberg, S. C., and Carpenter, L. J.: Technical Note: A fully automated purge and trap GC-MS system for quantification of volatile organic compound (VOC) fluxes between the ocean and atmosphere, Ocean Sci., 11, 313–321, https://doi.org/10.5194/os-11-313-2015, 2015.
Arévalo-Martínez, D. L., Beyer, M., Krumbholz, M., Piller, I., Kock, A., Steinhoff, T., Körtzinger, A., and Bange, H. W.: A new method for continuous measurements of oceanic and atmospheric N2O, CO and CO2: performance of off-axis integrated cavity output spectroscopy (OA-ICOS) coupled to non-dispersive infrared detection (NDIR), Ocean Sci., 9, 1071–1087, https://doi.org/10.5194/os-9-1071-2013, 2013.
Beale, R., Liss, P. S., and Nightingale, P. D.: First oceanic measurements of ethanol and propanol, Geophys. Res. Lett., 37, 1–5, https://doi.org/10.1029/2010GL045534, 2010.
Beale, R., Liss, P. S., Dixon, J. L., and Nightingale, P. D.: Quantification of oxygenated volatile organic compounds in seawater by membrane inlet-proton transfer reaction/mass spectrometry, Anal. Chim. Acta, 706, 128–134, https://doi.org/10.1016/j.aca.2011.08.023, 2011.
Beale, R., Dixon, J. L., Arnold, S. R., Liss, P. S., and Nightingale, P. D.: Methanol, acetaldehyde, and acetone in the surface waters of the Atlantic Ocean, J. Geophys. Res.-Oceans, 118, 5412–5425, https://doi.org/10.1002/jgrc.20322, 2013.
Blake, R. S., Monks, P. S., and Ellis, A. M.: Proton-transfer reaction mass spectrometry., Chem. Rev., 109, 861–896, https://doi.org/10.1021/cr800364q, 2009.
Blando, J. D. and Turpin, B. J.: Secondary organic aerosol formation in cloud and fog droplets: A literature evaluation of plausibility, Atmos. Environ., 34, 1623–1632, https://doi.org/10.1016/S1352-2310(99)00392-1, 2000.
Blomquist, B. W., Brumer, S. E., Fairall, C. W., Huebert, B. J., Zappa, C. J., Brooks, I. M., Yang, M., Bariteau, L., Prytherch, J., Hare, J. E., Czerski, H., Matei, A., and Pascal, R. W.: Wind Speed and Sea State Dependencies of Air-Sea Gas Transfer: Results From the High Wind Speed Gas Exchange Study (HiWinGS), J. Geophys. Res.-Oceans, 122, 8034–8062, https://doi.org/10.1002/2017JC013181, 2017.
Brewer, J. F., Bishop, M., Kelp, M., Keller, C. A., Ravishankara, A. R., and Fischer, E. V.: A sensitivity analysis of key natural factors in the modeled global acetone budget, J. Geophys. Res. Atmos., 122, 2043–2058, https://doi.org/10.1002/2016JD025935, 2017.
Butler, J. H., King, D. B., Lobert, J. M., Montzka, S. A., Yvon-Lewis, S. A., Hall, B. D., Warwick, N. J., Mondell, D. J., Aydin, M., and Elkins, J. W.: Oceanic distributions and emissions of short-lived halocarbons, Global Biogeochem. Cy., 21, 1–11, https://doi.org/10.1029/2006GB002732, 2007.
Carpenter, L. J., Archer, S. D., and Beale, R.: Ocean-atmosphere trace gas exchange, Chem. Soc. Rev., 41, 6473, https://doi.org/10.1039/c2cs35121h, 2012.
Charlson, R. J., Lovelock, J. E., Andreae, M. O., and Warren, S. G.: Oceanic phytoplankton, atmospheric sulphur, cloud albedo and climate, Nature, 326, 655–661, https://doi.org/10.1038/326655a0, 1987.
Claeys, M., Wang, W., Ion, A. C., Kourtchev, I., Gelencsér, A., and Maenhaut, W.: Formation of secondary organic aerosols from isoprene and its gas-phase oxidation products through reaction with hydrogen peroxide, Atmos. Environ., 38, 4093–4098, https://doi.org/10.1016/j.atmosenv.2004.06.001, 2004.
de Bruyn, W. J., Clark, C. D., Senstad, M., Barashy, O., and Hok, S.: The biological degradation of acetaldehyde in coastal seawater, Mar. Chem., 192, 13–21, https://doi.org/10.1016/j.marchem.2017.02.008, 2017.
de Gouw, J. A. and Warneke, C.: Measurements of Volatile Organic Compounds In the Earth's Atmosphere using Proton-Trasfer-Reaction Mass Spectrometry, Mass Spectrom. Rev., 26, 223–257, https://doi.org/10.1002/mas.20119, 2007.
Exton, D. A., Suggett, D. J., Steinke, M., and McGenity, T. J.: Spatial and temporal variability of biogenic isoprene emissions from a temperate estuary, Global Biogeochem. Cy., 26, 1–13, https://doi.org/10.1029/2011GB004210, 2012.
Fischer, E. V., Jacob, D. J., Millet, D. B., Yantosca, R. M., and Mao, J.: The role of the ocean in the global atmospheric budget of acetone, Geophys. Res. Lett., 39, 3–7, https://doi.org/10.1029/2011GL050086, 2012.
Hales, B., Takahashi, T., and Bandstra, L.: Atmospheric CO2 uptake by a coastal upwelling system, Global Biogeochem. Cy., 19, 1–11, https://doi.org/10.1029/2004GB002295, 2005.
Heald, C. L., Goldstein, A. H., Allan, J. D., Aiken, A. C., Apel, E., Atlas, E. L., Baker, A. K., Bates, T. S., Beyersdorf, A. J., Blake, D. R., Campos, T., Coe, H., Crounse, J. D., DeCarlo, P. F., de Gouw, J. A., Dunlea, E. J., Flocke, F. M., Fried, A., Goldan, P., Griffin, R. J., Herndon, S. C., Holloway, J. S., Holzinger, R., Jimenez, J. L., Junkermann, W., Kuster, W. C., Lewis, A. C., Meinardi, S., Millet, D. B., Onasch, T., Polidori, A., Quinn, P. K., Riemer, D. D., Roberts, J. M., Salcedo, D., Sive, B., Swanson, A. L., Talbot, R., Warneke, C., Weber, R. J., Weibring, P., Wennberg, P. O., Worsnop, D. R., Wittig, A. E., Zhang, R., Zheng, J., and Zheng, W.: Total observed organic carbon (TOOC) in the atmosphere: a synthesis of North American observations, Atmos. Chem. Phys., 8, 2007–2025, https://doi.org/10.5194/acp-8-2007-2008, 2008.
Huybrechts, T., Dewulf, J., Moerman, O., and Langenhove, H. Van: Evaluation of purge-and-trap – high-resolution gas chromatography – mass spectrometry for the determination of 27 volatile organic compounds in marine water at the ng 1-1 concentration level, J. Chromatogr., 893, 367–382, https://doi.org/10.1016/s0021-9673(00)00771-8, 2000.
Johnson, J. E.: Evaluation of a seawater equilibrator for shipboard analysis of dissolved oceanic trace gases, Anal. Chim. Acta, 395, 119–132, https://doi.org/10.1016/S0003-2670(99)00361-X, 1999.
Johnson, M. T.: A numerical scheme to calculate temperature and salinity dependent air-water transfer velocities for any gas, Ocean Sci., 6, 913–932, https://doi.org/10.5194/os-6-913-2010, 2010.
Kameyama, S., Tanimoto, H., Inomata, S., Tsunogai, U., Ooki, A., and Takeda, S.: High-resolution measurement of multiple volatile organic compounds dissolved in seawater using equilibrator inlet-proton transfer reaction-mass spectrometry (EI-PTR-MS), Mar. Chem., 122, 59–73, https://doi.org/10.1016/j.marchem.2010.08.003, 2010.
Karl, T., Yeretzian, C., Jordan, A., and Lindinger, W.: Dynamic measurements of partition coefficients using proton-transfer-reaction mass spectrometry (PTR-MS), Int. J. Mass Spectrom., 223–224, 383–395, https://doi.org/10.1016/S1387-3806(02)00927-2, 2003.
Leighton, D. T. and Calo, J. M.: Distribution Coefficients of Chlorinated Hydrocarbons in Dilute Air-Water Systems for Groundwater Contamination Applications, J. Chem. Eng. Data, 26, 382–385, https://doi.org/10.1021/je00026a010, 1981.
Leng, C., Kish, J. D., Kelley, J., Mach, M., Hiltner, J., Zhang, Y., and Liu, Y.: Temperature-dependent Henry's law constants of atmospheric organics of biogenic origin, J. Phys. Chem. A, 117, 10359–10367, https://doi.org/10.1021/jp403603z, 2013.
Lewis, A. C., Hopkins, J. R., Carpenter, L. J., Stanton, J., Read, K. A., and Pilling, M. J.: Sources and sinks of acetone, methanol, and acetaldehyde in North Atlantic marine air, Atmos. Chem. Phys., 5, 1963–1974, https://doi.org/10.5194/acp-5-1963-2005, 2005.
Lindinger, W. and Jordan, A.: Proton-transfer-reaction mass spectrometry (PTR–MS): on-line monitoring of volatile organic compounds at pptv levels, Chem. Soc. Rev., 27, 347–354, https://doi.org/10.1039/a827347z, 1998.
Liss, P. S. and Slater, P. G.: Flux of Gases across the Air-Sea Interface, Nature, 247, 181–184, https://doi.org/10.1038/247181a0, 1974.
McCarty, P. L. and Reinhard, M.: Trace organics removal by advanced wastewater treatment, J. Water Pollut. Control Fed., 52, 1907–1922, 1980.
Mochalski, P., King, J., Kupferthaler, A., Unterkofler, K., Hinterhuber, H., and Amann, A.: Measurement of isoprene solubility in water, human blood and plasma by multiple headspace extraction gas chromatography coupled with solid phase microextraction, J. Breath Res., 5, 1–8, https://doi.org/10.1088/1752-7155/5/4/046010, 2011.
Monks, P. S.: Gas-phase radical chemistry in the troposphere, Chem. Soc. Rev., 34, 376–395, https://doi.org/10.1039/b307982c, 2005.
Saeed, T. and Al-Mutairi, M.: Chemical composition of the watersoluble fraction of the leaded gasolines in seawater, Environ. Int., 25, 117–129, https://doi.org/10.1016/S0160-4120(98)00093-2, 1999.
Saltzman, E. S., De Bruyn, W. J., Lawler, M. J., Marandino, C. A., and McCormick, C. A.: A chemical ionization mass spectrometer for continuous underway shipboard analysis of dimethylsulfide in near-surface seawater, Ocean Sci., 5, 537–546, https://doi.org/10.5194/os-5-537-2009, 2009.
Sander, R.: Compilation of Henry's law constants (version 4.0) for water as solvent, Atmos. Chem. Phys., 15, 4399–4981, https://doi.org/10.5194/acp-15-4399-2015, 2015.
Burkholder, J. B., Sander, S. P., Abbatt, J., Barker, J. R., Huie, R. E., Kolb, C. E., Kurylo, M. J., Orkin, V. L., Wilmouth, D. M., and Wine, P. H.: Chemical Kinetics and Photochemical Data for Use in Atmospheric Studies, Evaluation No. 18, JPL Publication 15-10, Jet Propulsion Laboratory, Pasadena, available at: http://jpldataeval.jpl.nasa.gov (last access: 28 June 19), 2015.
Schlundt, C., Tegtmeier, S., Lennartz, S. T., Bracher, A., Cheah, W., Krüger, K., Quack, B., and Marandino, C. A.: Oxygenated volatile organic carbon in the western Pacific convective center: ocean cycling, air–sea gas exchange and atmospheric transport, Atmos. Chem. Phys., 17, 10837–10854, https://doi.org/10.5194/acp-17-10837-2017, 2017.
Schwarz, K., Filipiak, W., and Amann, A.: Determining concentration patterns of volatile compounds in exhaled breath by PTR-MS, J. Breath Res., 3, 1–15, https://doi.org/10.1088/1752-7155/3/2/027002, 2009.
Sims, R. P., Schuster, U., Watson, A. J., Yang, M. X., Hopkins, F. E., Stephens, J., and Bell, T. G.: A measurement system for vertical seawater profiles close to the air–sea interface, Ocean Sci., 13, 649–660, https://doi.org/10.5194/os-13-649-2017, 2017.
Tortell, P. D.: Dissolved gas measurements in oceanic waters made by membrane inlet mass spectrometry, Limnol. Oceanogr.-Meth., 3, 24–37, https://doi.org/10.4319/lom.2005.3.24, 2005.
Warneke, C., Van Der Veen, C., Luxembourg, S., De Gouw, J. A., and Kok, A.: Measurements of benzene and toluene in ambient air using proton-transfer-reaction mass spectrometry: Calibration, humidity dependence, and field intercomparison, Int. J. Mass Spectrom., 207, 167–182, https://doi.org/10.1016/S1387-3806(01)00366-9, 2001.
Williams, J., Holzinger, R., Gros, V., Xu, X., Atlas, E., and Wallace, D. W. R.: Measurements of organic species in air and seawater from the tropical Atlantic, Geophys. Res. Lett., 31, 1–5, https://doi.org/10.1029/2004GL020012, 2004.
Xie, H., C, Z. O., Wang, W. E. I., and Taylor, C. D.: A Simple Automated Continuous-Flow-Equilibration Method for Measuring Carbon Monoxide in Seawater, Environ. Sci. Technol., 35, 1475–1480, 2001.
Yang, M. and Fleming, Z. L.: Estimation of atmospheric total organic carbon (TOC) – paving the path towards carbon budget closure, Atmos. Chem. Phys., 19, 459–471, https://doi.org/10.5194/acp-19-459-2019, 2019.
Yang, M., Blomquist, B. W., Fairall, C. W., Archer, S. D., and Huebert, B. J.: Air – sea exchange of dimethylsulfide in the Southern Ocean?: Measurements from SO GasEx compared to temperate and tropical regions, J. Geophys. Res., 116, 1–17, https://doi.org/10.1029/2010JC006526, 2011.
Yang, M., Beale, R., Smyth, T., and Blomquist, B.: Measurements of OVOC fluxes by eddy covariance using a proton-transfer-reaction mass spectrometer – method development at a coastal site, Atmos. Chem. Phys., 13, 6165–6184, https://doi.org/10.5194/acp-13-6165-2013, 2013a.
Yang, M., Nightingale, P. D., Beale, R., Liss, P. S., Blomquist, B. W., and Fairall, C. W.: Atmospheric deposition of methanol over the Atlantic Ocean., P. Natl. Acad. Sci. USA, 110, 20034–20039, https://doi.org/10.1073/pnas.1317840110, 2013b.
Yang, M., Blomquist, B. W., and Nightingale, P. D.: Air-sea exchange of methanol and acetone during HiWinGS: Estimation of air phase, water phase gas transfer velocities, J. Geophys. Res.-Oceans, 119, 7308–7323, https://doi.org/10.1002/2014JC010227, 2014.
Yaws, C. L. and Yang, H.-C.: Henry's law constant for compound in water, in: Thermodynamic and Physical Property Data, edited by: Yaws, C. L., Gulf Publishing Company, Houston, TX, 1992.
Zhao, J. and Zhang, R.: Proton transfer reaction rate constants between hydronium ion (H3O+) and volatile organic compounds, Atmos. Environ., 38, 2177–2185, https://doi.org/10.1016/j.atmosenv.2004.01.019, 2004.
Zhu, Y. and Kieber, D. J.: Wavelength- and Temperature-Dependent Apparent Quantum Yields for Photochemical Production of Carbonyl Compounds in the North Pacific Ocean, Environ. Sci. Technol., 52, 1929–1939, https://doi.org/10.1021/acs.est.7b05462, 2018.
- Abstract
- Introduction
- System description
- Derivation of dissolved VOC concentrations from SFCE–PTR-MS measurements
- SFCE testing
- Field deployment
- Conclusion and recommendations
- Data availability
- Author contributions
- Competing interests
- Acknowledgements
- Financial support
- Review statement
- References
- Supplement