the Creative Commons Attribution 4.0 License.
the Creative Commons Attribution 4.0 License.
 | 28 Jan 2020
Effects of large-scale floating (solar photovoltaic) platforms on hydrodynamics and primary production in a coastal sea from a water column model
Thodoris Karpouzoglou
Brigitte Vlaswinkel
Johan van der Molen
An improved understanding of the effects of floating solar platforms on the ecosystem is necessary to define acceptable and responsible real-world field implementations of this new marine technology. This study examines a number of potential effects of offshore floating solar photovoltaic (PV) platforms on the hydrodynamics and net primary production in a coastal sea for the first time. Three contrasting locations within the North Sea (a shallow and deeper location with well-mixed conditions and a seasonally stratifying location) have been analysed using a water column physical–biogeochemical model: the General Ocean Turbulence Model coupled with the European Regional Seas Ecosystem Model – Biogeochemical Flux Model (GOTM-ERSEM-BFM). The results show strong dependence on the characteristics of the location (e.g. mixing and stratification) and on the density of coverage with floating platforms. The overall response of the system was separated into contributions by platform-induced light deficit, shielding by the platforms of the sea surface from wind and friction induced by the platforms on the currents. For all three locations, light deficit was the dominant effect on the net primary production. For the two well-mixed locations, the other effects of the platforms resulted in partial compensation for the impact of light deficit, while for the stratified location, they enhanced the effects of light deficit. For up to 20 % coverage of the model surface with platforms, the spread in the results between locations was relatively small, and the changes in net primary production were less than 10 %. For higher percentages of coverage, primary production decreased substantially, with an increased spread in response between the sites. The water column model assumes horizontal homogeneity in all forcings and simulated variables, also for coverage with floating platforms, and hence the results are applicable to very-large-scale implementations of offshore floating platforms that are evenly distributed over areas of at least several hundreds of square kilometres, such that phytoplankton remain underneath a farm throughout several tidal cycles. To confirm these results, and to investigate more realistic cases of floating platforms distributed unevenly over much smaller areas with horizontally varying hydrodynamic conditions, in which phytoplankton can be expected to spend only part of the time underneath a farm and effects are likely to be smaller, spatial detail and additional processes need to be included. To do so, further work is required to advance the water column model towards a three-dimensional modelling approach.


With a growing world population and growing global energy demand, new options need to be explored to generate energy. While traditional fossil fuels emit carbon dioxide and other harmful gases which cause global temperature to rise, renewable forms of energy offer a sustainable alternative that can remediate climate change. Two of the most promising sources of renewable energy are the Sun and the wind. Wind farms are built both onshore and offshore, but utility-scale photovoltaic (PV) solar farms have until now only been installed on land. Growing space constraints, higher land costs, increased public resistance and competition with other functions will ultimately set a limit to the potential of onshore solar development, especially in densely populated areas. Such constraints may be less relevant at sea, and offshore solar energy generation has huge potential.
Large-scale floating solar farms, reaching up to 1.4 km2 (70 MW), already exist inshore (https://www.pv-tech.org/news/worlds-largest-floating-solar-plant-connected-in-china, last access: 1 June 2019) and are rapidly being developed all around the world (da Silva and Branco, 2018). The effects of these structures on the ecosystem have been discussed mainly for standing water environments (Santafe et al., 2014; Sahu et al., 2016; da Silva and Branco, 2018). These studies argue that (inshore) floating platforms decrease the evaporation rate and increase water quality by reducing primary production due to the light deficit introduced by the platforms. However, these studies did not investigate these effects in detail. The potential of offshore solar energy has recently been highlighted in several policy roadmaps in the Netherlands, and the world's first demonstration of an offshore solar farm of 50 kW is expected to be operational by the beginning of 2020 (https://www.reuters.com/article/netherlands-solar-offshore/dutch-plan-to-build-giant-offshore-solar-power-farm, last access: 21 January 2020), stressing the need to investigate potential environmental effects.
At sea, only a few small-scale tests have been carried out with floating PV concepts (Trapani and Millar, 2012; Grech et al., 2016; https://www.swimsol.com/#lagoonoceansun.no, last access: 21 January 2020). There are substantial differences between offshore and inshore environments caused by stronger winds, higher waves and the presence of tides, which causes the water column underneath the floating platforms to be constantly replaced. Moreover, the water motion induced by wave and tidal processes suspends sediments, which affect the underwater light climate and consequently net primary production (Wetsteyn and Kromkamp, 1994). Offshore floating platforms have the potential to influence these processes. Hence, the effects of such platforms on marine ecosystems are expected to be different from those in standing (fresh) water and require separate investigation. As of yet, there are no studies that consider the possible environmental effects of offshore floating platforms on the marine ecosystem.
This study investigates the potential effects of large-scale arrays of offshore floating platforms on the ecosystem of coastal seas such as the North Sea, adjacent to the Netherlands. Although the study focused on floating PV platforms, the results also apply to other offshore structures that reduce wind forcing and/or light penetration and/or introduce additional friction, for instance, seaweed farms. The North Sea is a relatively shallow marginal sea (average depth 74 m) of the Atlantic Ocean. It is located between the continent of western Europe and the United Kingdom, and covers an area of about 570 000 km2 (Otto et al., 1990). The hydrodynamics of the North Sea are controlled by tides, winds and buoyancy gradients. In the shallower regions of the Southern Bight of the North Sea, tidal currents are strong and wind waves can cause substantial near-bed wave-orbital velocities, resulting in well-mixed conditions during the whole year (Sündermann and Pohlmann, 2011; Pickering et al., 2012). In deeper areas further to the north, tidal currents are weaker and wave effects rarely reach the seabed, allowing temperature stratification during summer (van Leeuwen et al., 2015). Such stratification limits vertical exchange of nutrients and determines the timing of the spring bloom (Sverdrup, 1953; Ruardij et al., 1997). We hypothesise that offshore floating platforms will modify currents, waves and stratification, and primary production. The platforms will induce light deficit underwater, reducing heat input and likely affecting temperature stratification. We also expect reductions in underwater light intensity to affect phytoplankton growth. The friction of the rigid platforms with the tidal currents and shielding of the water surface from the wind are expected to result in weaker currents. The platforms can also be expected to have an impact on waves. Changes due to these forcings will affect turbulence and the resulting vertical mixing, suspended sediment and nutrient concentrations, and phytoplankton growth.
Here, we assess three contrasting locations in the North Sea for which time-series observations of hydrographic and biological quantities are available: a shallow and a deeper well-mixed site, and a seasonally stratified site. We focus on changes in net primary production induced by the effects of floating platforms on the physical environment. In absence of field observations with floating platforms present, we used a water column model to obtain first estimates of the potential effects of covering part of the sea-surface area on hydrodynamics and net primary production. We have made the necessary assumptions such that these estimates are near the upper limits of the effects. This model allowed for easy development and testing of the implementation of the effects of the floating structures on light (light deficit), wind forcing (shielding) and currents (platform friction). For more detailed, spatially resolved results, and to include additional processes, substantial further work is needed.
The following research questions are addressed in this paper:
-
What is the overall potential effect of floating platforms on the net primary production at different locations in the North Sea as a function of coverage density?
-
What is the relative importance of the individual effects of platform-induced light deficit, wind shielding and platform friction?
-
For which percentages of coverage does the model suggest noticeable changes in the response of primary production?
2.1 Study sites and observations
Three study sites were selected for which time-series observations of hydrographical and biogeochemical variables were available, with contrasting hydrographic conditions: Oyster Grounds (54.41∘ N, 4.02∘ E), Noordwijk-10 (52.301∘ N, 4.303∘ E) and West Gabbard (51.9895∘ N, 2.08983∘ E) (Fig. 1). Oyster Grounds is located at 45 m depth and stratifies every summer between April and October (Tijssen and Wetsteyn, 1984). It is characterised by relatively low tidal current velocities, low suspended sediment concentrations and low primary production. The West Gabbard and Noordwijk-10 sites are located at 32 and 18 m depth, respectively. Both locations are characterised by relatively strong tidal currents, high suspended sediment concentration and high primary production (van der Molen et al., 2016; https://data.gov.uk, last access: 21 January 2020). The West Gabbard location remains well mixed during the entire year. The Noordwijk-10 location can stratify by combined temperature and salinity effects when river outflow is high (de Kok et al., 2001). For the purpose of this study, we ignore salinity effects at Noordwijk-10, which may lead to an underestimation of the occasional stratification.
At the three study sites, time-series observations were collected using SmartBuoys deployed by the Centre for Environment, Fisheries and Aquaculture Science (Cefas) (http://data.cefas.co.uk/#/View/66, last access: 1 June 2019). SmartBuoys are moored, automated, multi-parameter recording platforms which are used to collect marine environmental data. They measure, at 1 m below the sea surface, salinity, temperature, turbidity, oxygen saturation, chlorophyll fluorescence, and nitrate and silicate concentration. Data were collected in 10 min bursts; here, we have used daily averages. The buoys also collected and preserved water samples which were used to calibrate the sensor data. For this study, we used observations from the following years: from 2006 to 2008 for Oyster Grounds and West Gabbard, and from 2001 to 2002 for Noordwijk-10.
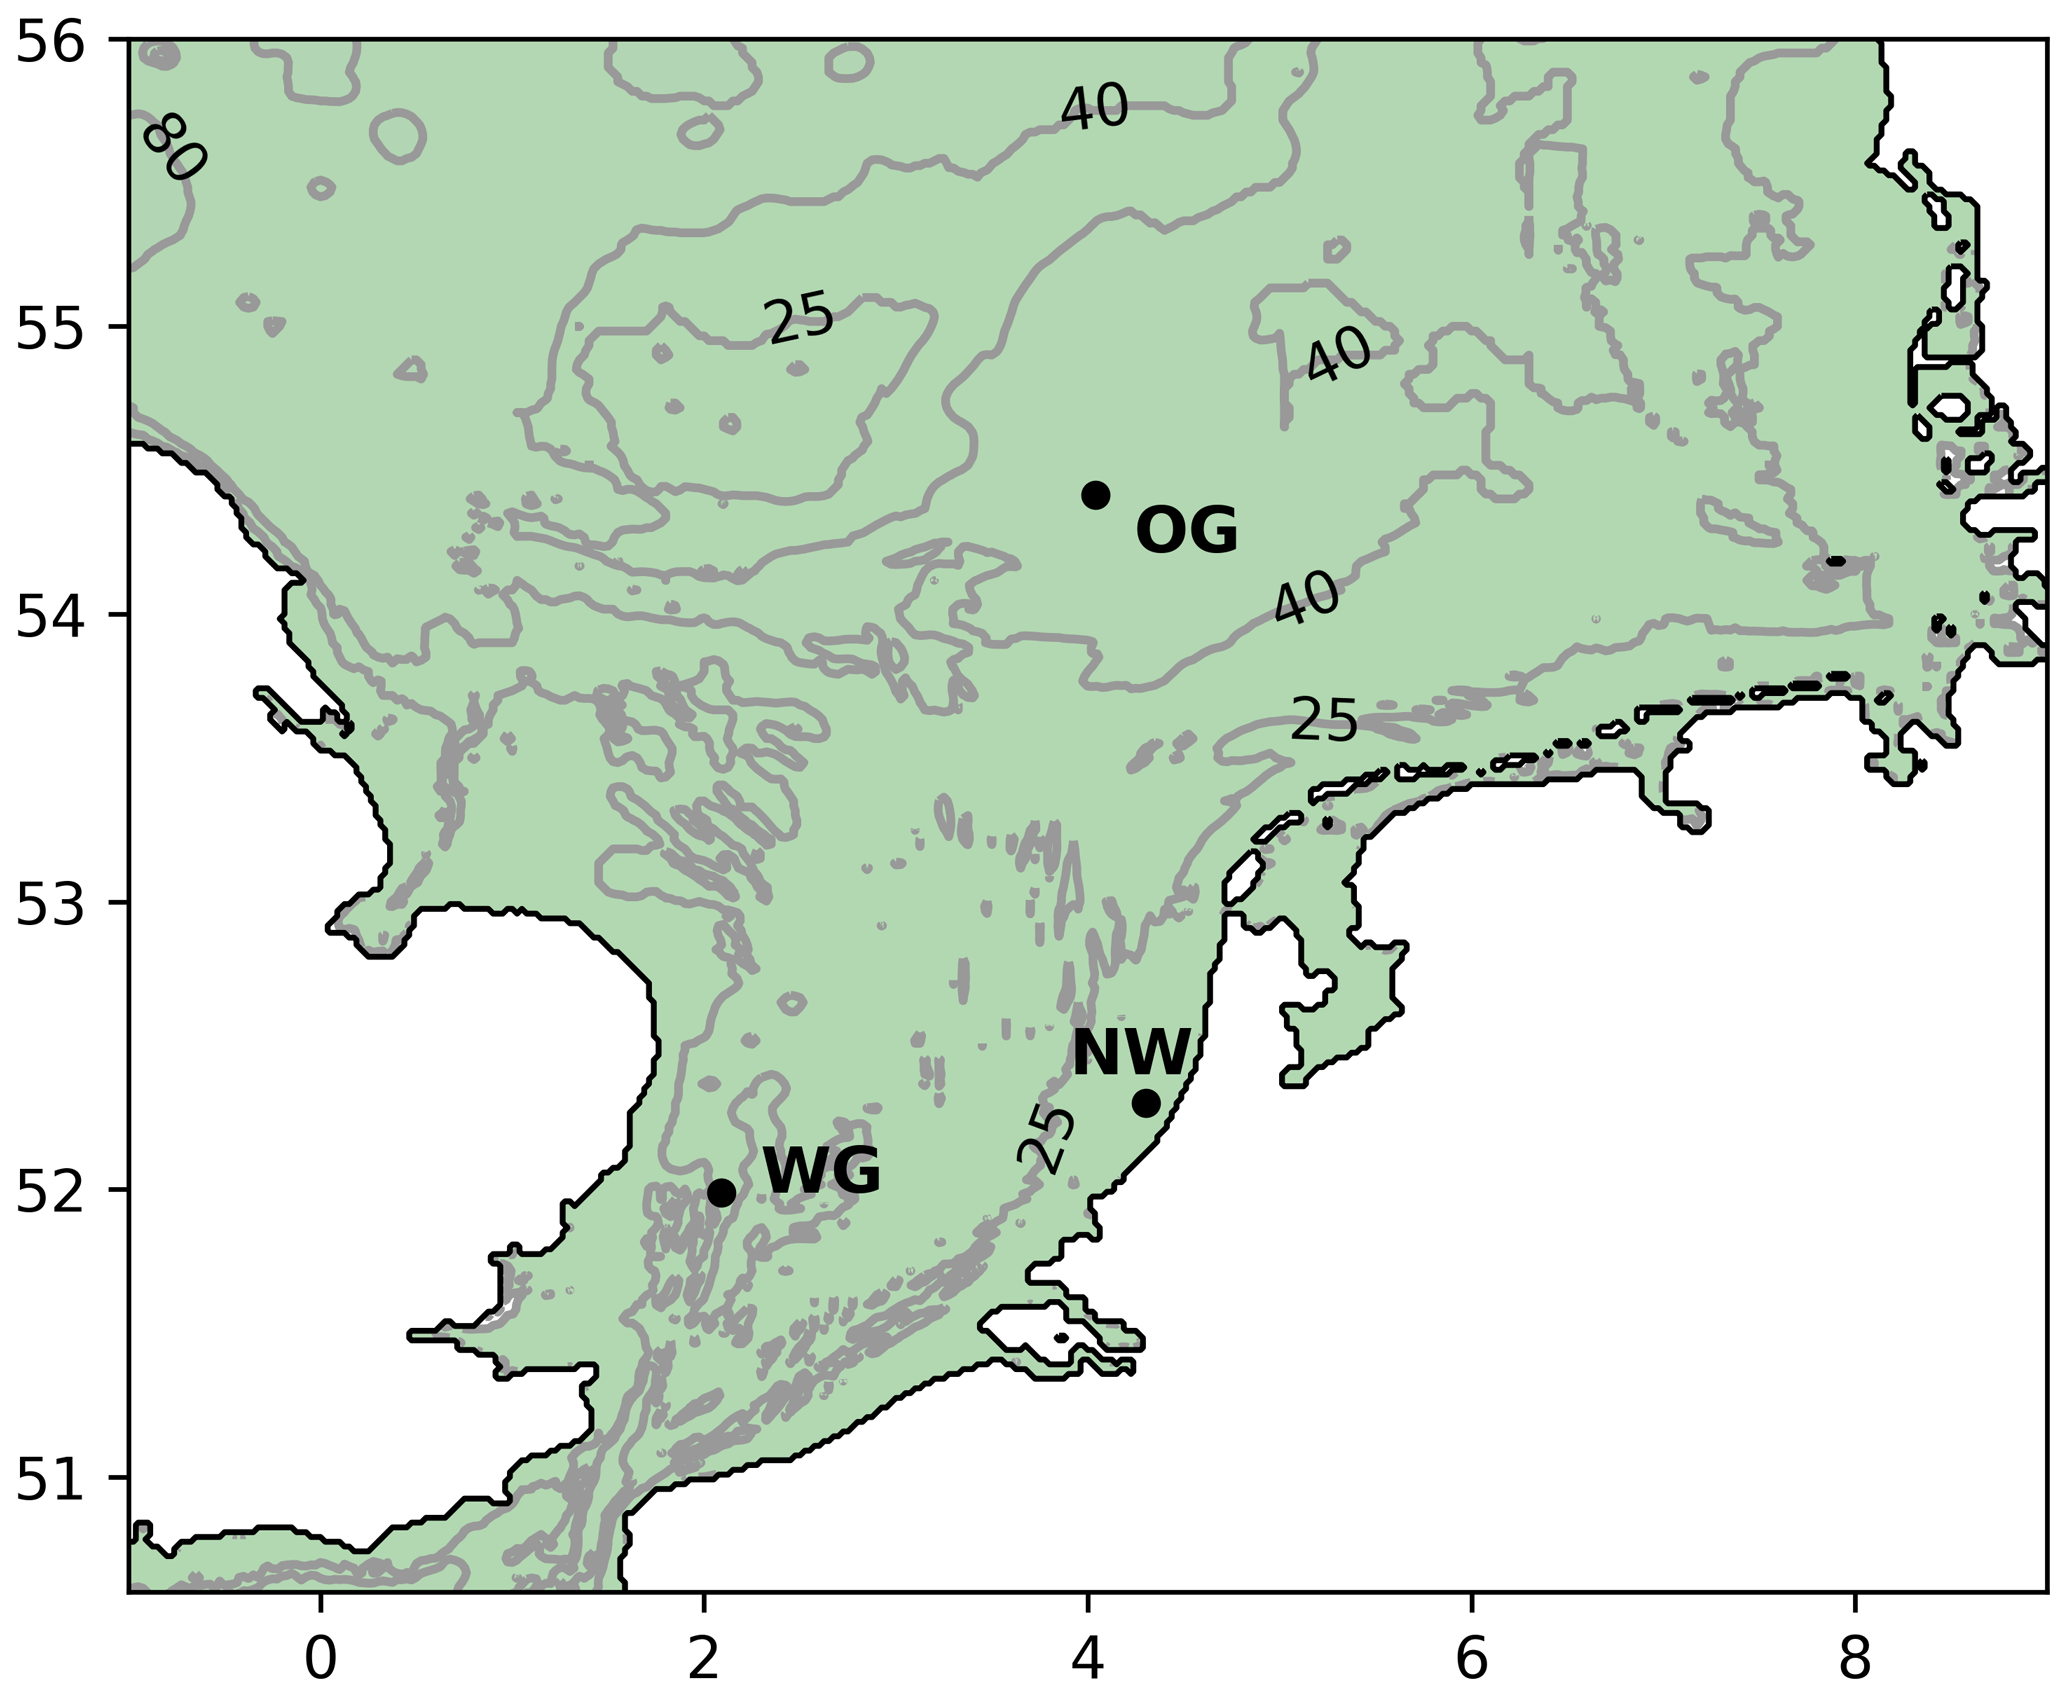
Figure 1Map with the SmartBuoy stations of Oyster Grounds (OG), West Gabbard (WG) and Noordwijk-10 (NW).
2.2 Model description
For the purpose of this work, the General Ocean Turbulence Model coupled with the European Regional Seas Ecosystem Model – Biogeochemical Flux Model (GOTM-ERSEM-BFM) was used. The GOTM (Burchard et al., 2006; https://www.gotm.net, last access: 21 January 2020) is a public domain, one-dimensional finite-difference water column model that includes the most important hydrodynamic and thermodynamic processes related to vertical mixing in natural waters. The model solves the one-dimensional vertical (1-DV) Reynolds-averaged Navier–Stokes equations and the Reynolds-averaged transport equations of temperature and salinity, under the Boussinesq and hydrostatic approximations. In this offshore application of GOTM, salinity was considered constant. The model was forced with meteorological hindcast data obtained from the European Centre for Medium-Range Weather Forecasts (ECMWF) ERA-40 (https://apps.ecmwf.int/datasets/data/era40-daily/levtype=sfc/, last access: 1 June 2019). Moreover, it was forced with time series of depth-averaged tidal velocities reconstructed from the harmonic analysis of a 3-D model (van der Molen et al., 2017). The model uses these depth-averaged velocities to set up spatial gradients of external pressure that it uses as forcing. GOTM uses all these forcings, including bed-shear stress, to calculate the time evolution of vertical distributions of turbulence and currents (Burchard et al., 2006). It is also possible to explicitly force GOTM with spatial gradients, e.g. to simulate salinity stratification (Simpson et al., 2002), but this was not used here.
Coupled with GOTM, ERSEM-BFM was used. ERSEM-BFM is a development of the ERSEM III model (Baretta et al., 1995; Ruardij et al., 1997; Vichi et al., 2007; van der Molen et al., 2018; https://www.nioz.nl/en/about/cos/ecosystemmodelling, last access: 21 January 2020). It is a pelagic–benthic ecosystem model describing the biogeochemical fluxes in the lower trophic levels of the marine food web. The model simulates the cycles of carbon, nitrogen, phosphorus, silicate and oxygen, allowing for variable internal nutrient ratios within the different groups. Within the 1-D model context, nitrogen, phosphorus and silicate are fully conserved. N2 gas produced by denitrification processes is fed back immediately as nitrate in the form of atmospheric deposition. Carbon and oxygen are exchanged with unlimited atmospheric pools at constant concentration. The model applies a functional group approach and contains six pelagic phytoplankton groups (diatoms, flagellates, picophytoplankton, resuspended benthic diatoms, dinoflagellates and Phaeocystis), four zooplankton groups and five benthic faunal groups (four macrofauna and one meiofauna groups). Pelagic and benthic aerobic and anaerobic bacteria are also included. The model also simulates suspended particulate matter (SPM) concentrations in response to waves and currents, which influence the underwater light conditions and net primary production (van der Molen et al., 2017). A simple wave model (based on the Sverdrup–Munk–Bretschneider method, U.S. Army Corps of Engineers, 1984; see van der Molen et al., 2014) is used to calculate significant wave height, period and direction. Resuspension of detritus is coupled to the resuspension of sediment. As inclusion of Phaeocystis without a riverine nutrient source led to spurious interannual variations, it was excluded from the calculations.
The model calculates light attenuation in the vertical, accounting for absorption by (1) clear water, (2) coloured dissolved organic matter (CDOM), (3) suspended mineral sediment, (4) chlorophyll and (5) suspended organic matter (detritus). For a mathematical description of light attenuation in the model, see Appendix B.
2.3 Implementation of platforms
GOTM-ERSEM-BFM was modified to allow representation of the spatially averaged effects of the floating platforms on the hydrodynamics and ecosystem dynamics of the water column. The model accounted for the platforms through the introduction of three individual effects that can be activated separately or together: the light deficit due to the platforms, shielding of the water surface from the wind and the friction of the platforms acting on the currents. The implementation allowed for variable platform coverage as a fraction of the model surface. As the model represents averaged conditions over a unit surface area at each depth interval, it cannot distinguish between different ways of distributing this coverage over the unit surface area, nor include details of platform dimensions or design, and for the purpose of this study we assume the coverage to be distributed uniformly in space, in an area-averaged sense. The platform-induced light deficit and the wind shielding effects were expressed by a linear reduction of surface irradiance and surface wind stress with coverage. The frictional effects of the platforms on the currents were represented, similarly to the bottom friction, by an additional surface shear stress that was calculated with the logarithmic law of the wall, applied as a linear function of coverage. For mathematical expressions of the implementation of the floating structures, see Appendix A. In absence of design details of operational systems, the roughness of the platforms is as yet not known and may also vary during deployment due to biofouling. As a first approximation, the roughness height of the floating structures was assumed equal to that of the seabed (h0s=0.05 m). A series of experiments with varying values of h0s between 0.0125 and 0.4 m was carried out to provide insight into sensitivity of the model results to this parameter. Apart from coverage, this was the only parameter associated with the addition of floating platforms to the model. A sensitivity analysis of other parameters is beyond the scope of this paper, and the reader is referred to Sect. 3.1 for a comparison with observations.
2.4 Model setup and initial conditions
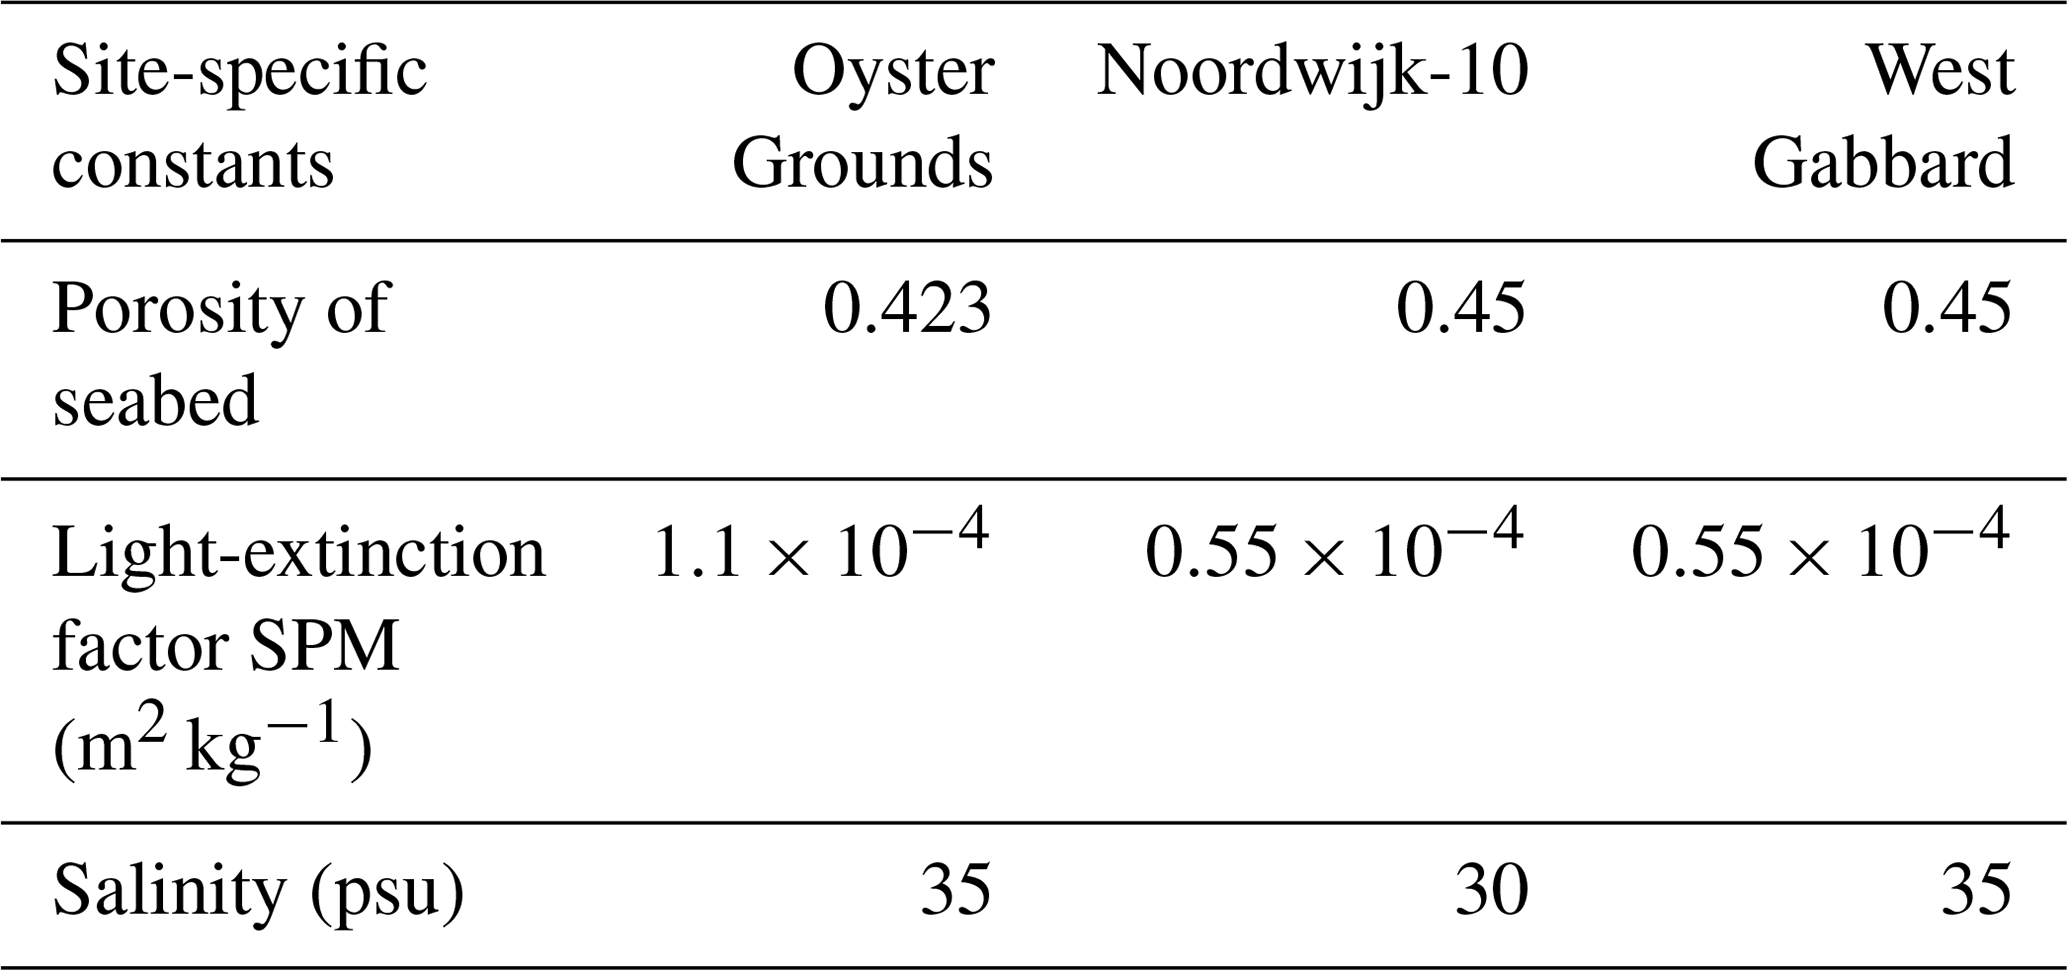
For each site, a water column model was set up with 40 vertical levels with increased resolution near the surface and bottom. Time steps were 300 s for the hydrodynamics and 3600 s for the biology. Site-specific values for the porosity of the seabed and salinity were defined based on observations (Table 1). The light-extinction factor for suspended sediment (the contribution to the light-extinction coefficient by suspended sediment is this factor multiplied by the suspended sediment concentration) was kept at the standard value for West Gabbard and Noordwijk-10, but it was twice the standard value for Oyster Grounds as that gave better results. As the water column model is a closed system that conserves nitrogen, phosphorus and silicon, it can only reproduce observations if the total amount for each nutrient integrated across all ecosystem components reflects the average amount present in the vicinity of the site. In absence of direct observations of the amounts of nutrients in all ecosystem compartments, we tuned the initial concentrations of nitrate, silicate, phosphate and benthic detritus in such a way that the model results, after a spin-up period of 26 years, matched the observed biogeochemical data as well as possible for each site. Benthic detritus is by far the largest pool of carbon and nutrients in the model, so using it to set the nutrient content of the 1-D model in combination with a long spin-up of more than twice the response time of the benthic system to redistribute this content appropriately within the ecosystem is a simple and effective tuning approach. Because for two of the three sites only a few years of observations were available, and differences between years had to be accounted for in the tuning process, we did not have enough data for an independent validation of the model. The tuning of the initial conditions of the model was done by minimising the value of the root mean square error (RMSE) and maximising the value of the correlation coefficient between the modelled and observed time series for chlorophyll a, nitrate and silicate. The model setup with initial values that gave the minimum RMSE, and maximum correlation was chosen for the simulations.
2.5 Model experiments
The resulting model was run for the period 1972–2008 for each site, providing daily outputs. The first 26 years were considered as spin-up, and only the years 1998–2008 were taken into account for the results. A reference run without platforms was carried out first. Subsequently, four scenarios were defined to investigate the separate effects of (1) platform-induced light deficit, (2) wind shielding, (3) platform friction and (4) to simulate the combined overall effect. For each effect, model runs were conducted for different values of coverage fraction (0.1–1.0 in steps of 0.1). The high end of this range may never be reached in practical applications but was included here for completeness. The sensitivity of the time-averaged (over the whole run period), depth-integrated values of modelled net primary production to platform coverage was evaluated for the different effects and the different locations, and the relative change was calculated compared to the reference run without platforms. To investigate the model response in more detail, climatological depth-integrated yearly time series and vertical profiles averaged over the 1998–2008 period were also calculated and compared. Finally, for each site, and for the combined overall effect of the platforms, the sensitivity of the modelled net primary production to the roughness of the platforms was investigated by setting the values of the roughness height of the platforms to h0s=0.0125, 0.025, 0.05, 0.1, 0.2 and 0.4 m.
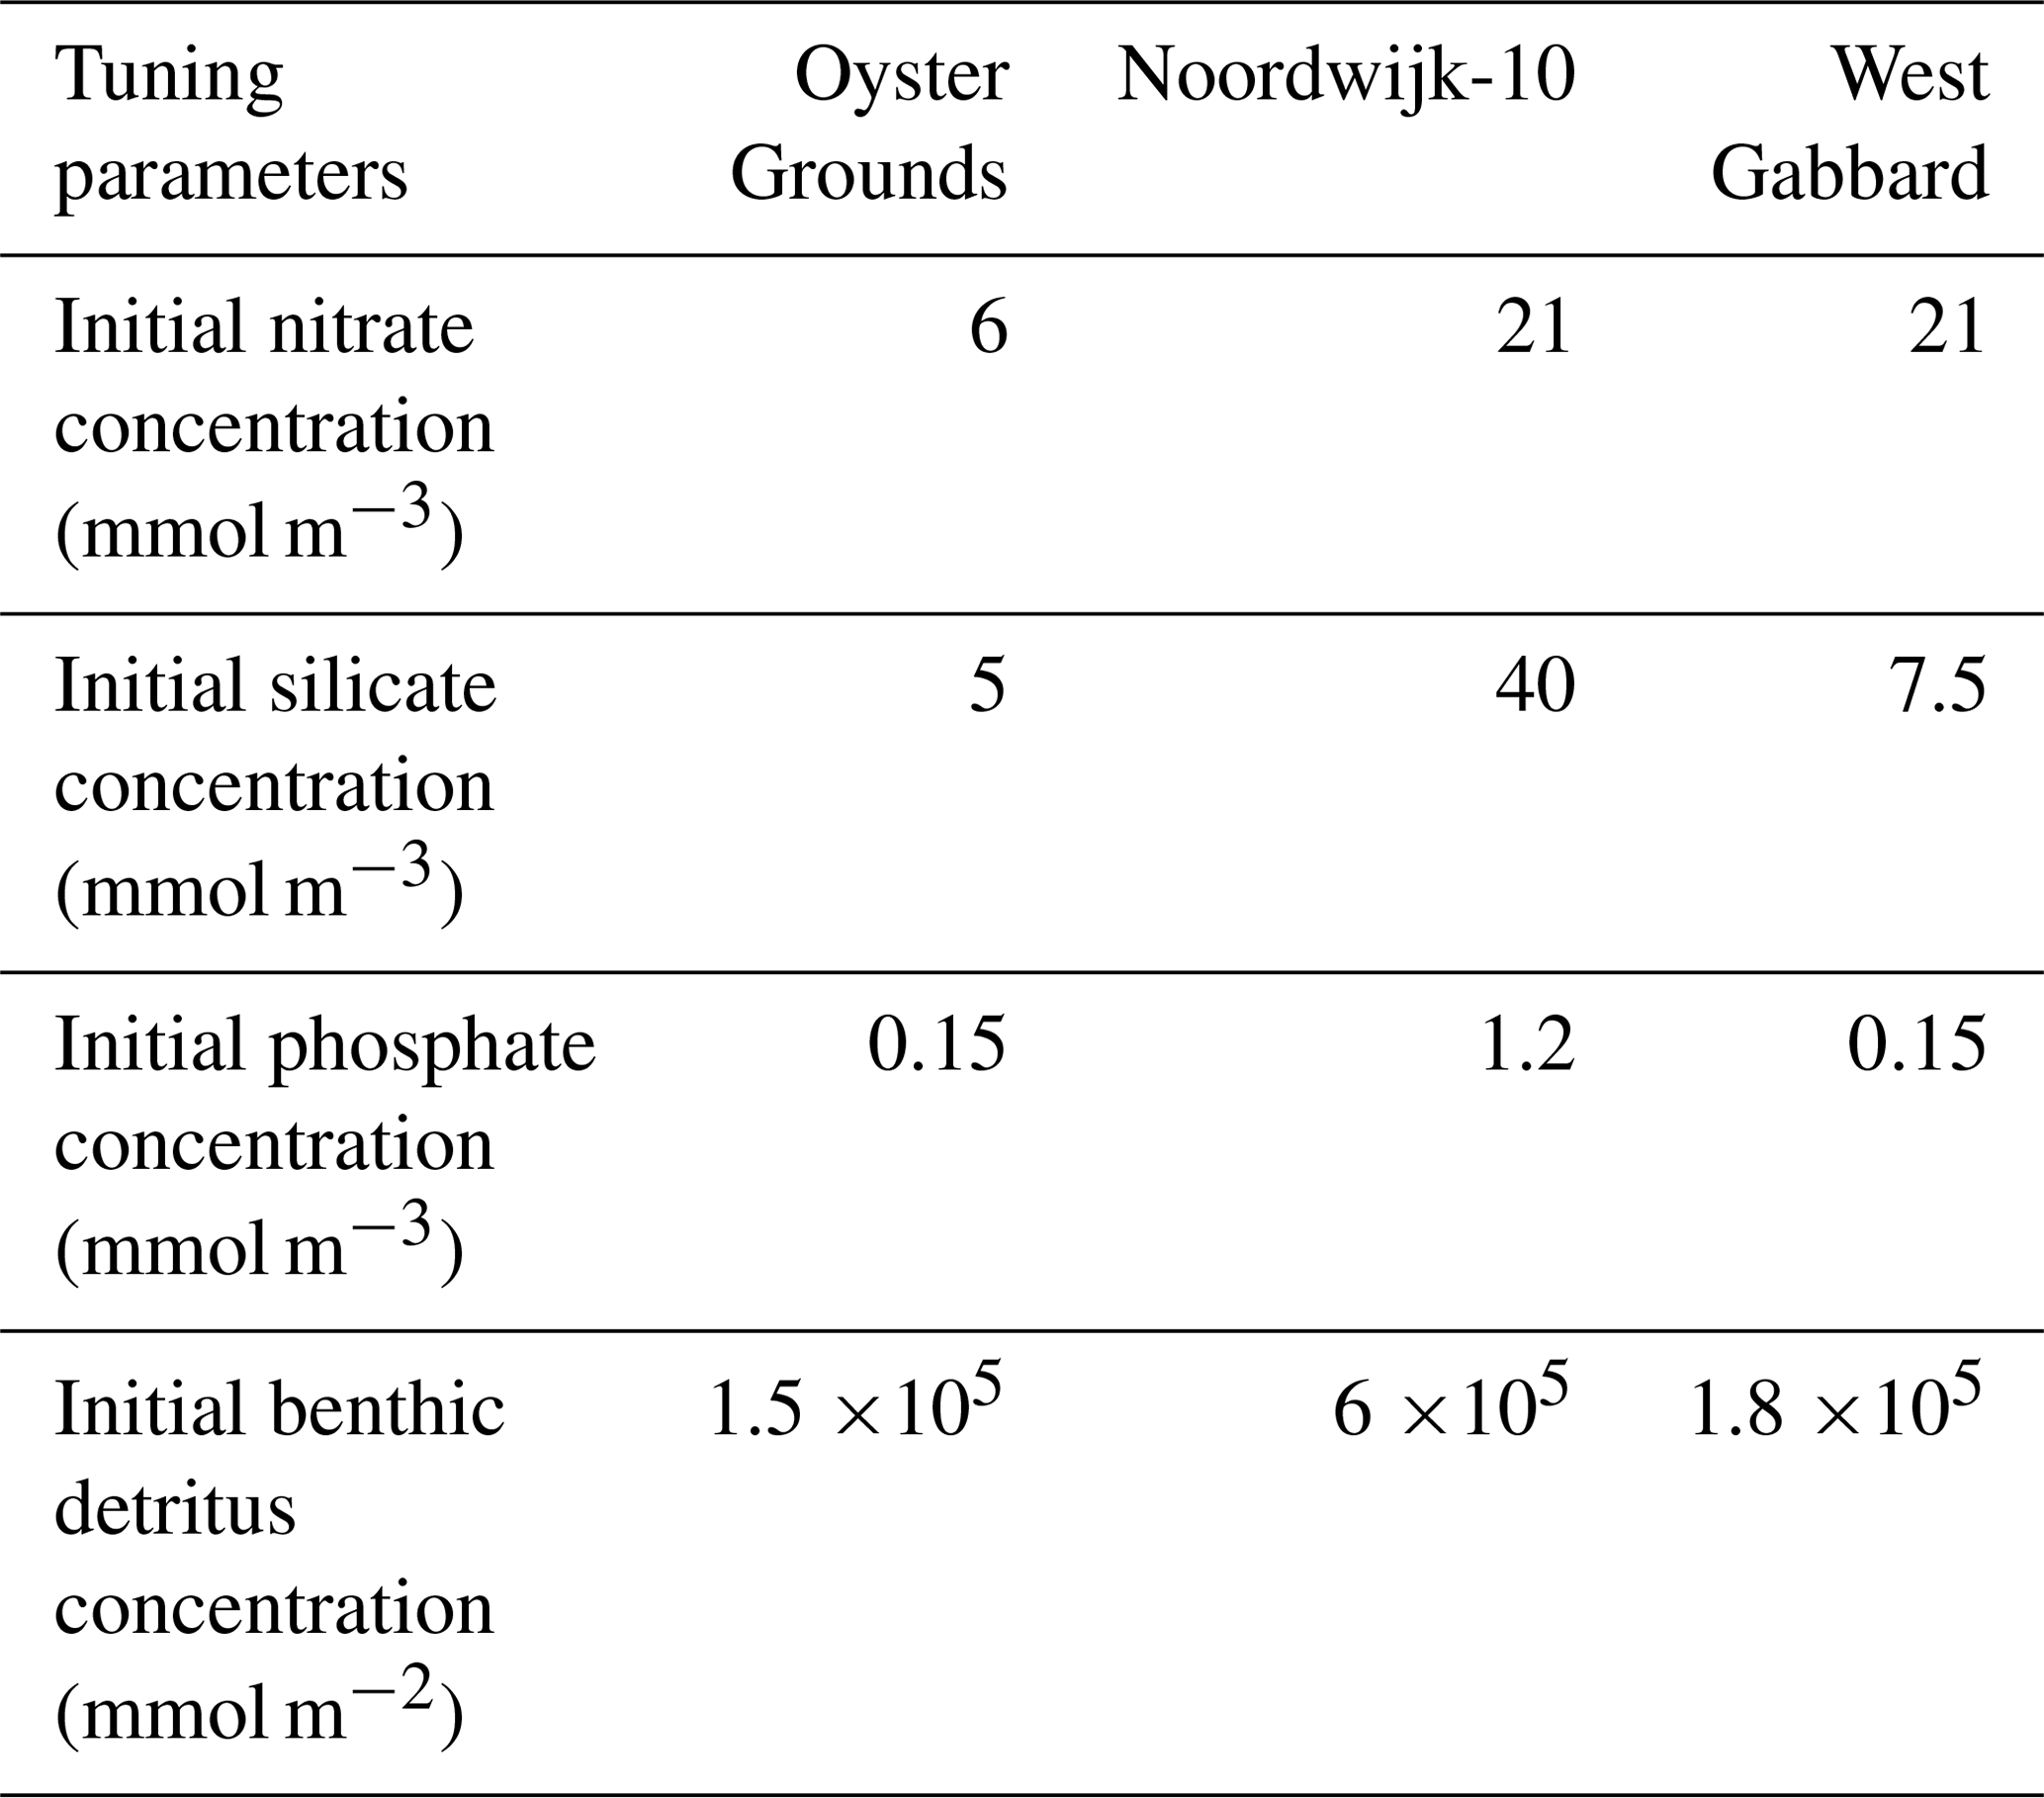

Figure 2Assessment of the model's performance (blue line) for the three locations through comparison with observations from the SmartBuoys (red crosses). The variables of chlorophyll a (a, d, g), nitrate (b, e, h) and silicate (c, f, i) are presented.
3.1 Tuning initial conditions
The resulting values of the tuning parameters, the initial concentrations of nitrate, silicate, phosphate and benthic detritus, are given in Table 2. The values of the minimum RMSE and maximum correlation coefficient between modelled and observed time series are given in Table 3. The results of the model with tuned initial conditions were compared with the observations for chlorophyll a (Fig. 2a, d, g), nitrate (panels b, e, h) and silicate (panels c, f, i).
Table 3The RMSE and correlation coefficient, after tuning, between the modelled and observed time series for chlorophyll a, nitrate and silicate.
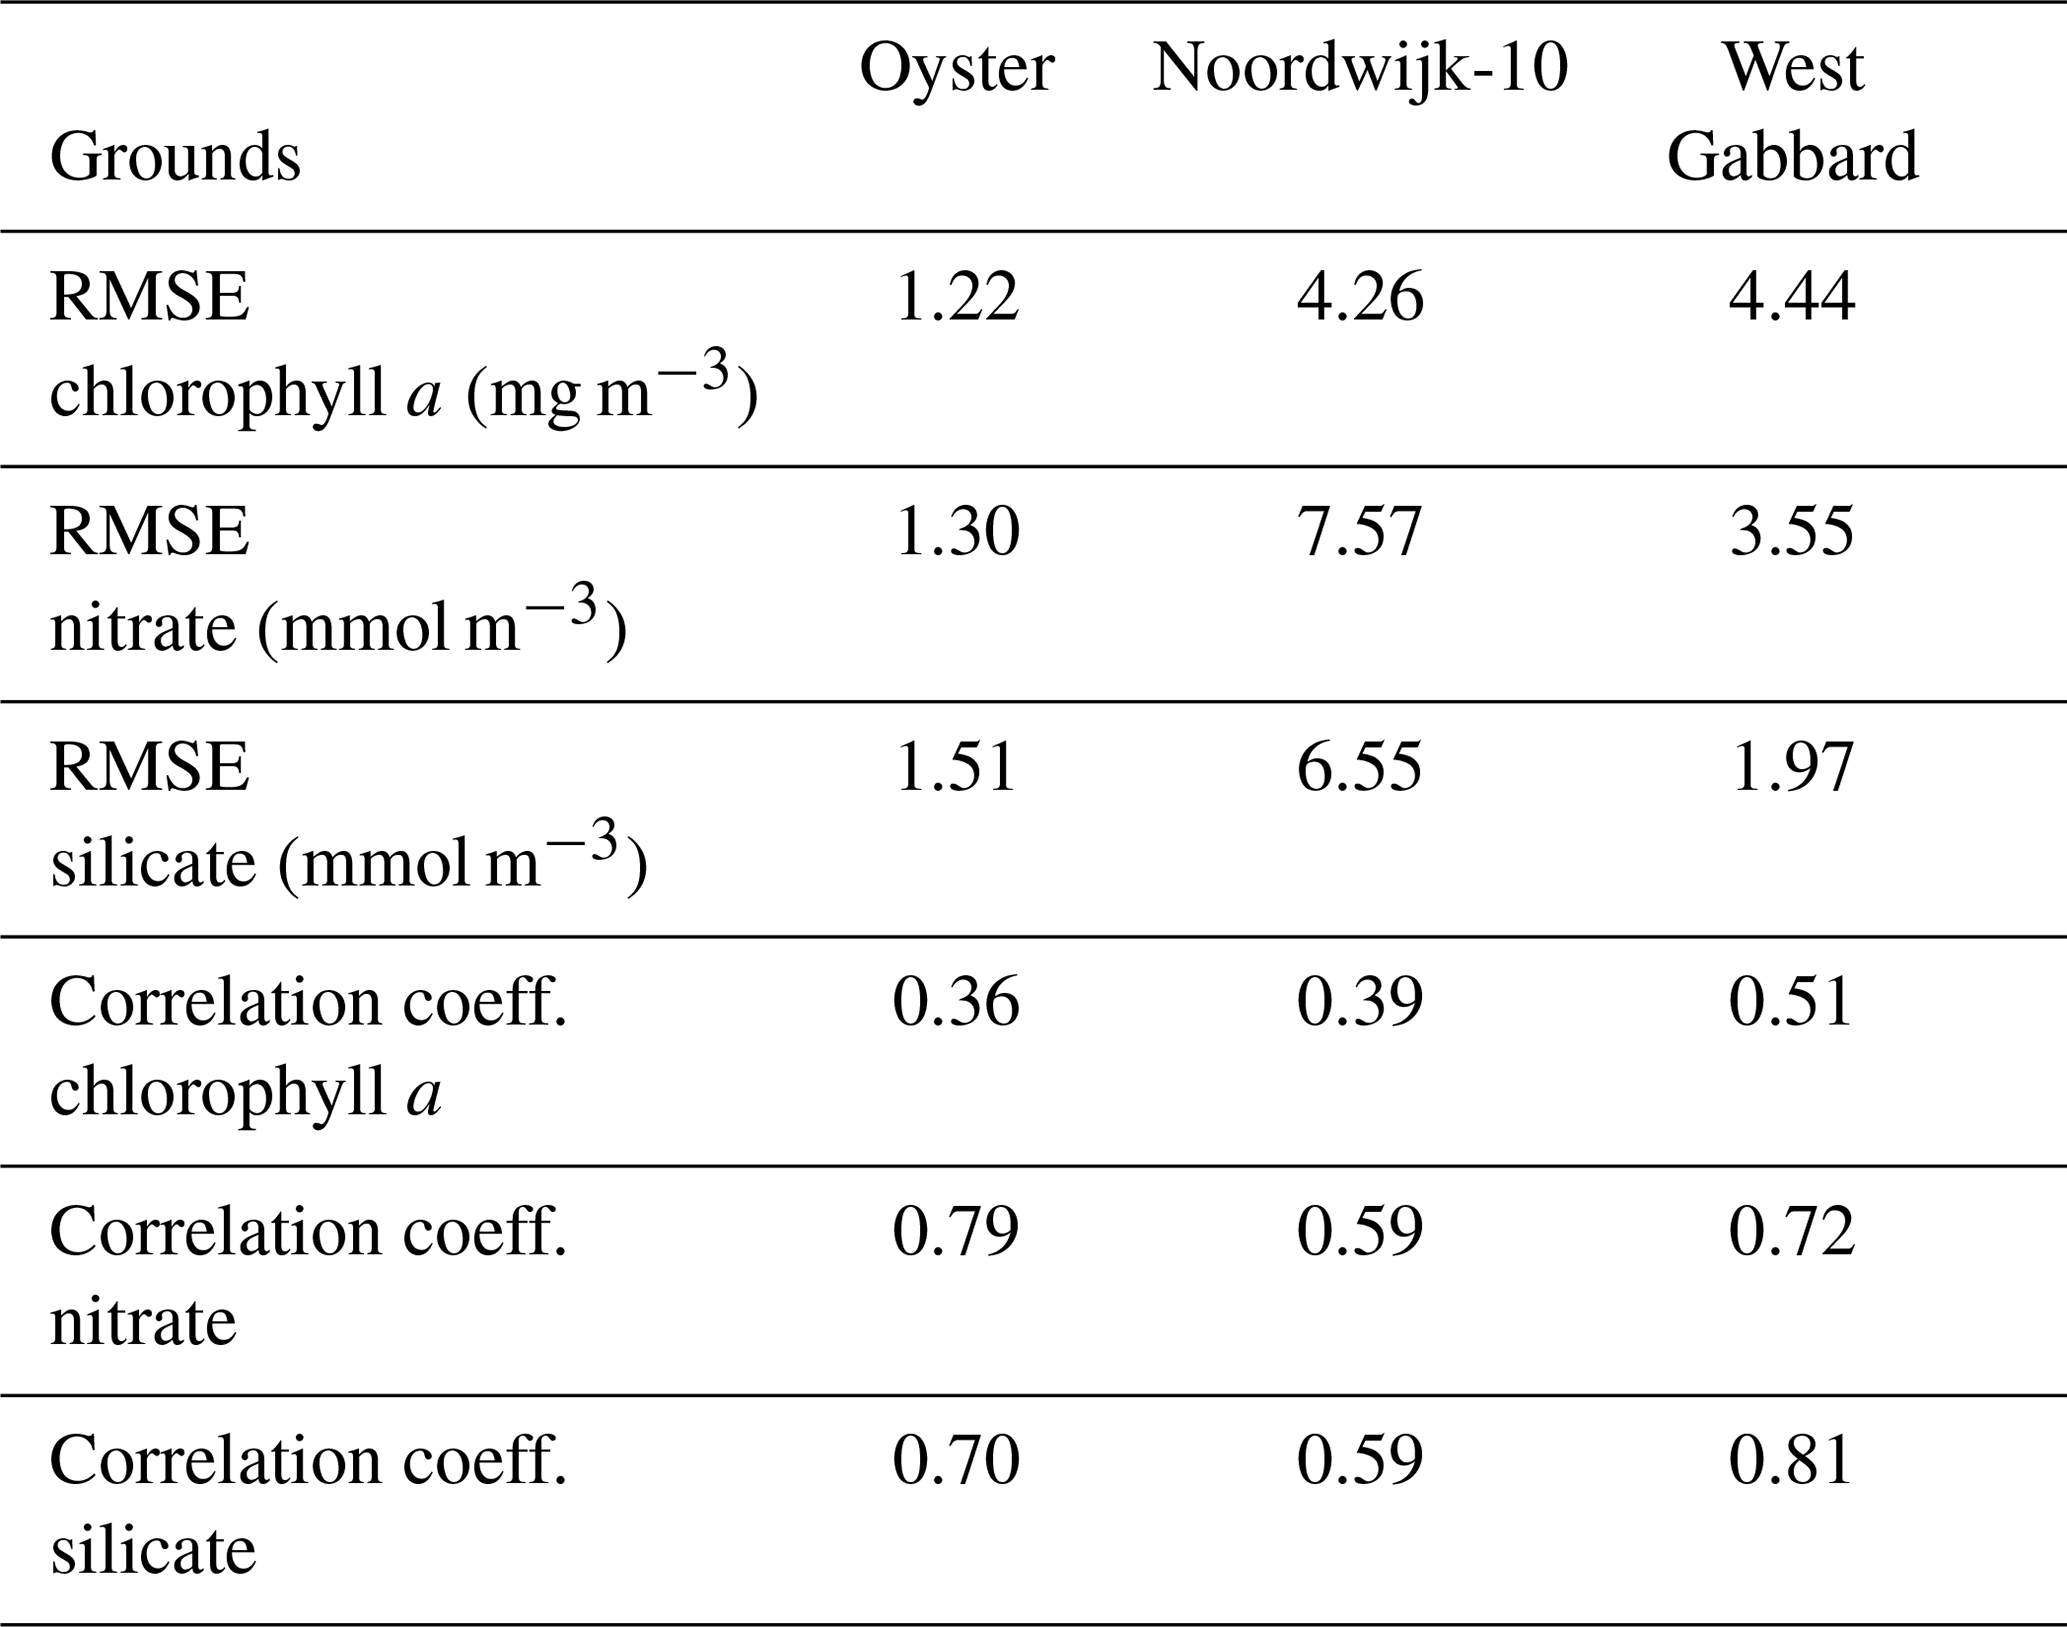
Overall, the model reproduced the seasonality of the three locations well. For silicate and nitrate, the agreement between model and observations was better for the locations of Oyster Grounds and West Gabbard than for Noordwijk-10 (see also Table 3). For chlorophyll a, the model reproduced the seasonal cycle at the three sites but underestimated the high concentrations during the spring bloom at West Gabbard and Noordwijk-10 (Fig. 2). These locations are characterised by frequent blooms of Phaeocystis (Blauw et al., 2010) (excluded from the model because inclusion led to spurious interannual variability within the 1-D model context; see Sect. 2.2).
3.2 Sensitivity of net primary production to coverage
3.2.1 Comparison between locations
To compare the effect of floating platforms between the three locations (research question 1), the relative change in net primary production was plotted as a function of coverage (Fig. 3). The response was different at each of the three locations, but all sites showed, with increasing coverage, a limited reduction in net primary production, followed by an accelerated reduction leading to a strong decline of net primary productivity. Taking all sites together, three ranges of coverage can be distinguished. From 0 % to approximately 20 % coverage, the difference in response between the three locations was relatively small. Also, the impact of the floating platforms on net primary production was relatively small (less than 10 % reduction), while for West Gabbard even a small increase was simulated because of a reduction in suspended sediment concentrations (see below for more details). Within this range of coverage, the two well-mixed locations appeared more resilient to the effects of the platforms than the stratified location of Oyster Grounds. From roughly 20 % to approximately 40 % coverage, an increased spread in the results occurred between the three sites. Beyond approximately 40 % of coverage, the net primary production at the two well-mixed locations sloped down rapidly. A similar decline at the Oyster Grounds occurred later, at 60 %–80 % coverage. These results suggest a different response for the stratified than for the two well-mixed locations. The two well-mixed locations appeared more resilient to small percentages of coverage, while they experienced an earlier decline of primary production.
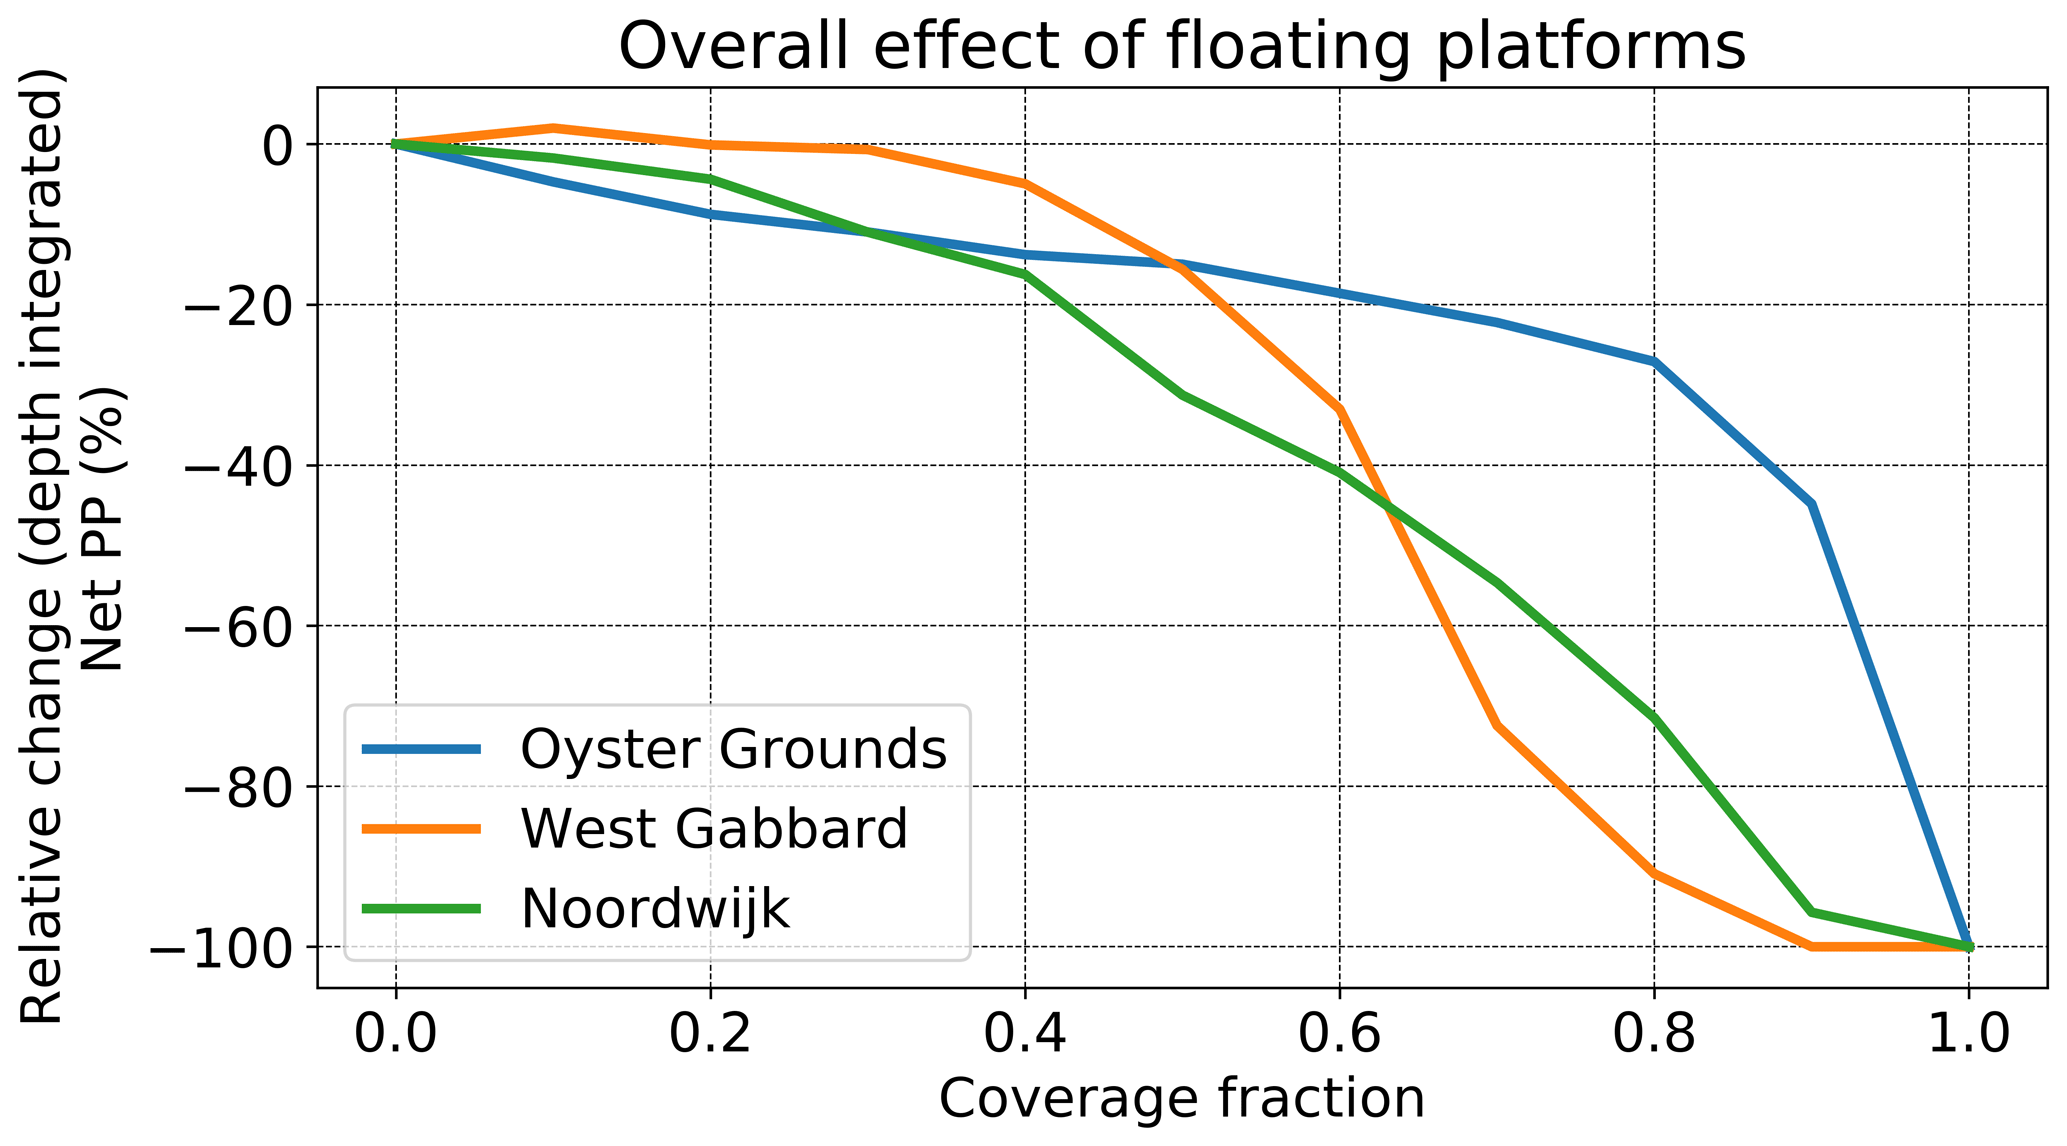
Figure 3Relative change against the reference of net primary production with increasing coverage under the overall effect of floating platforms for the three locations of the experiment.
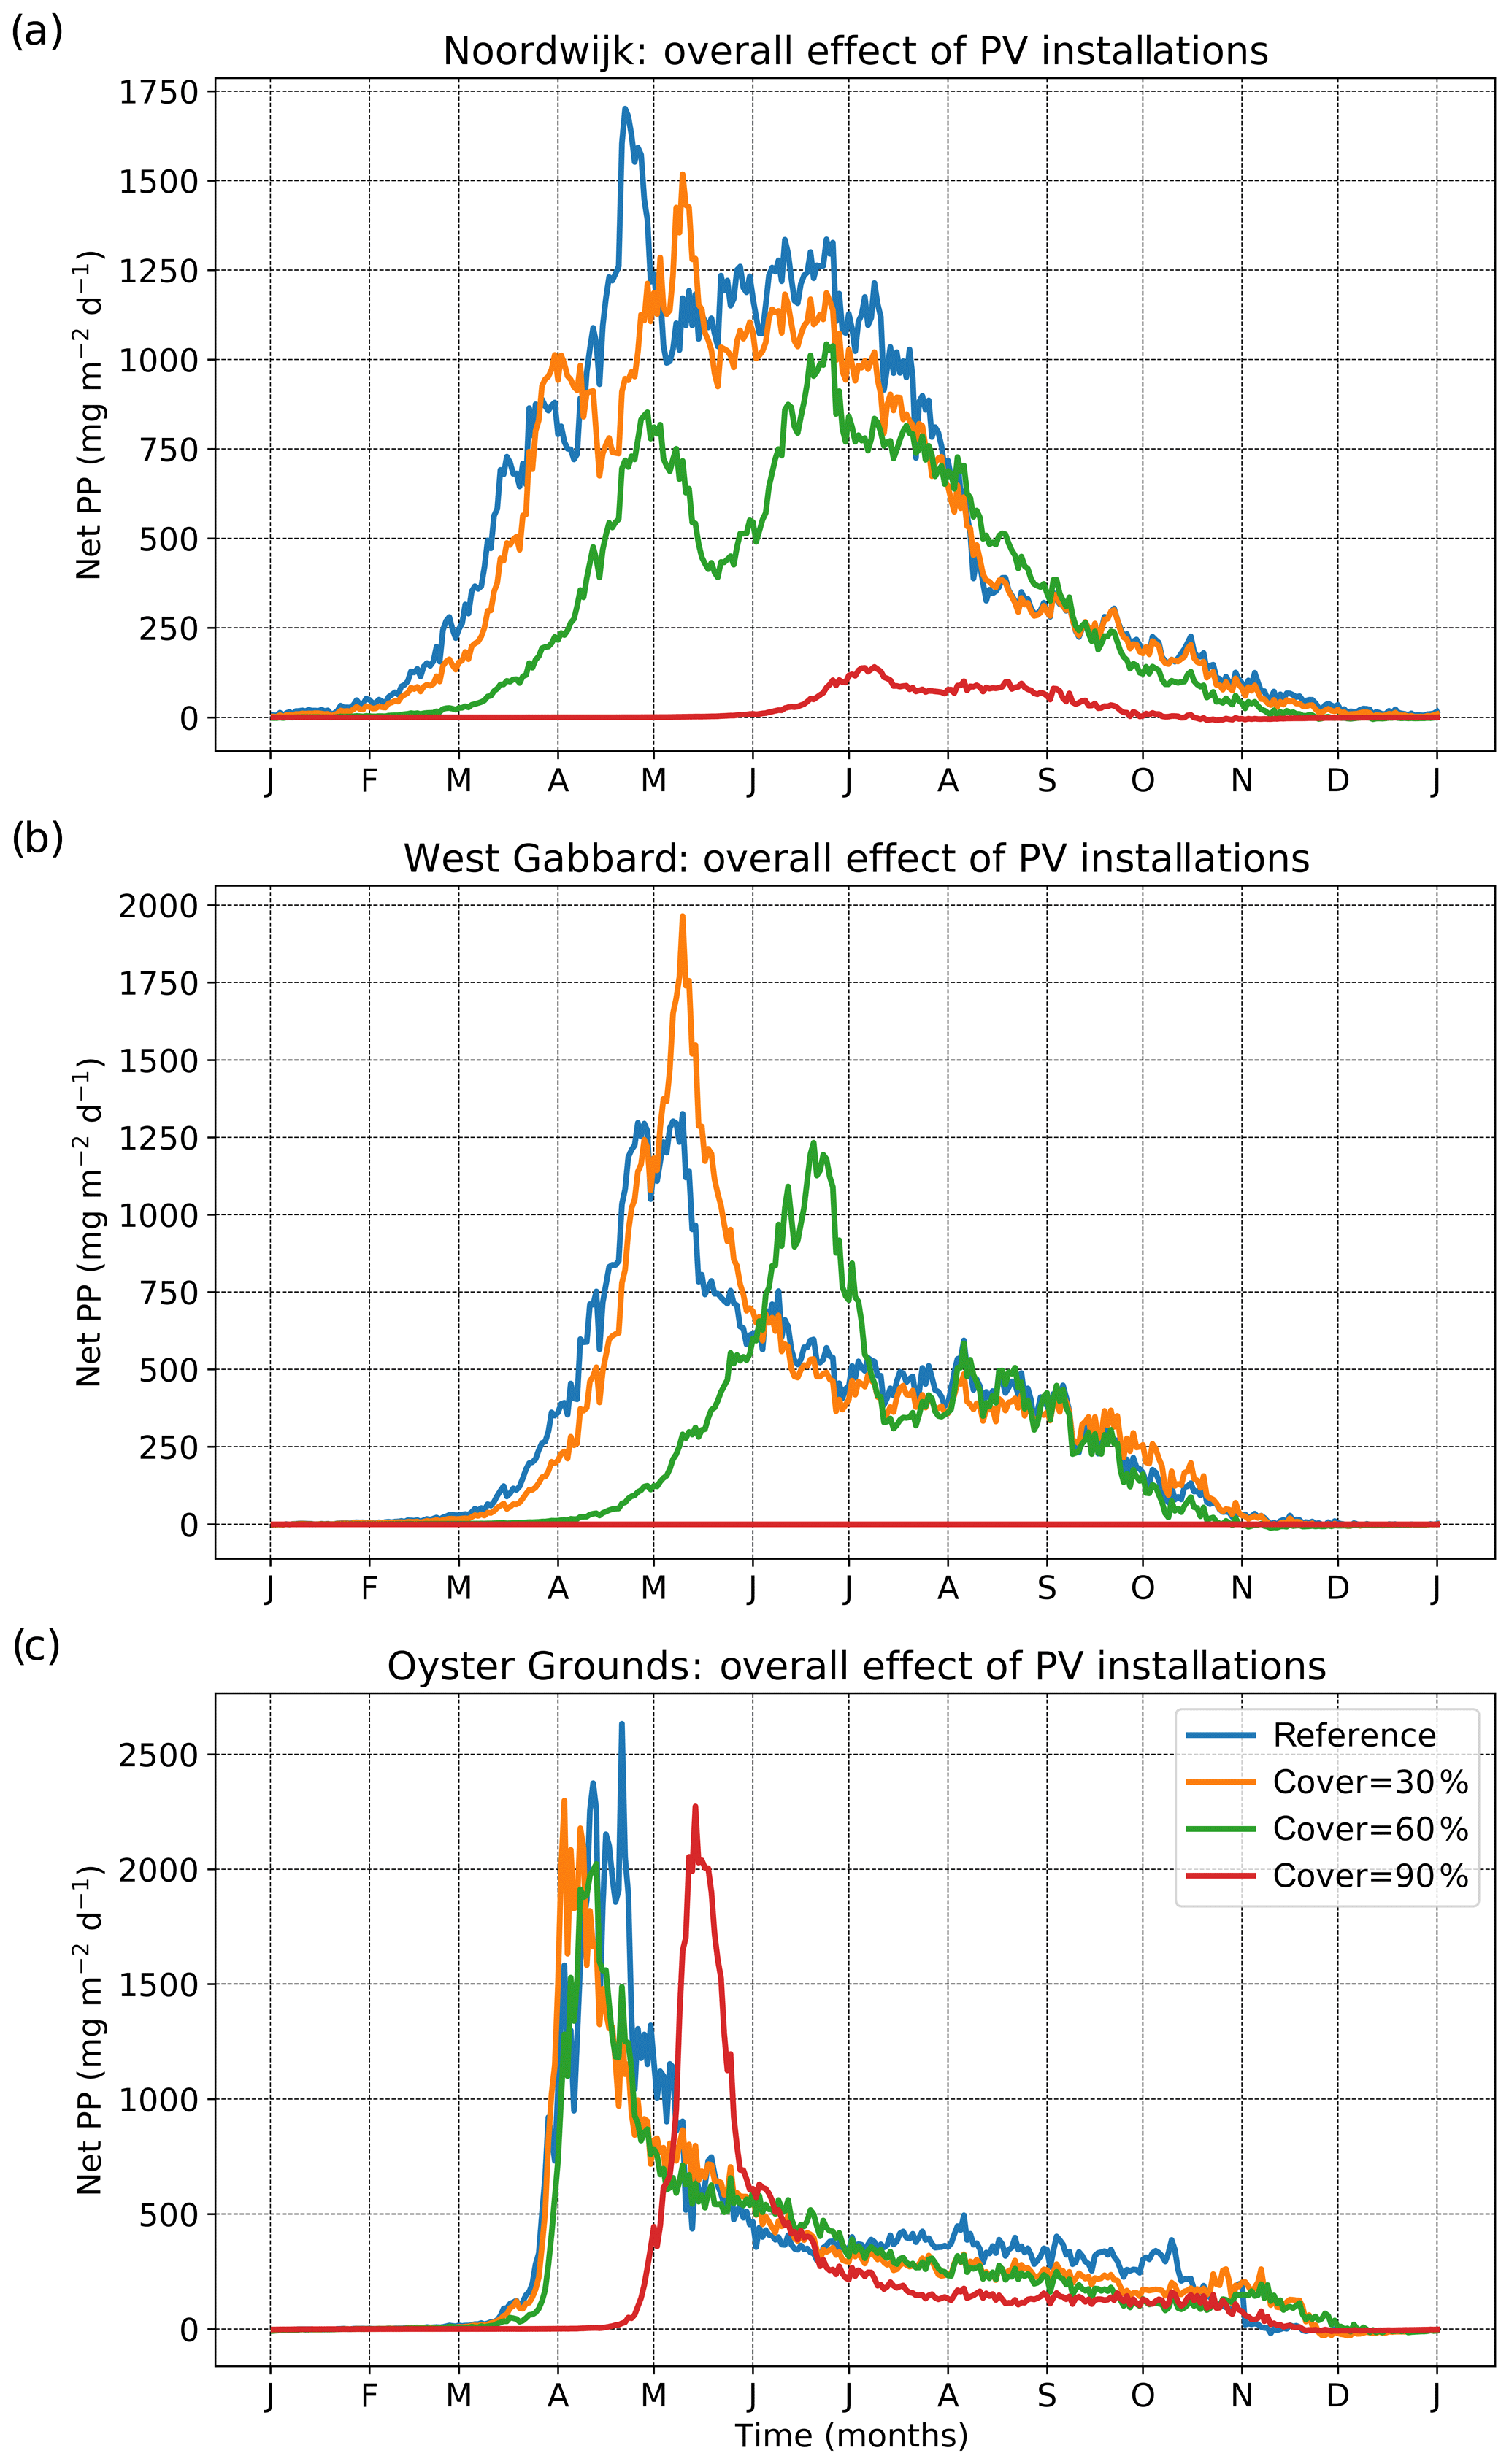
Figure 4Depth-integrated yearly time series (averaged over 1998–2008) of net primary production for the three locations of the experiment. The results are presented for different scenarios of coverage under the overall effect of floating platforms.
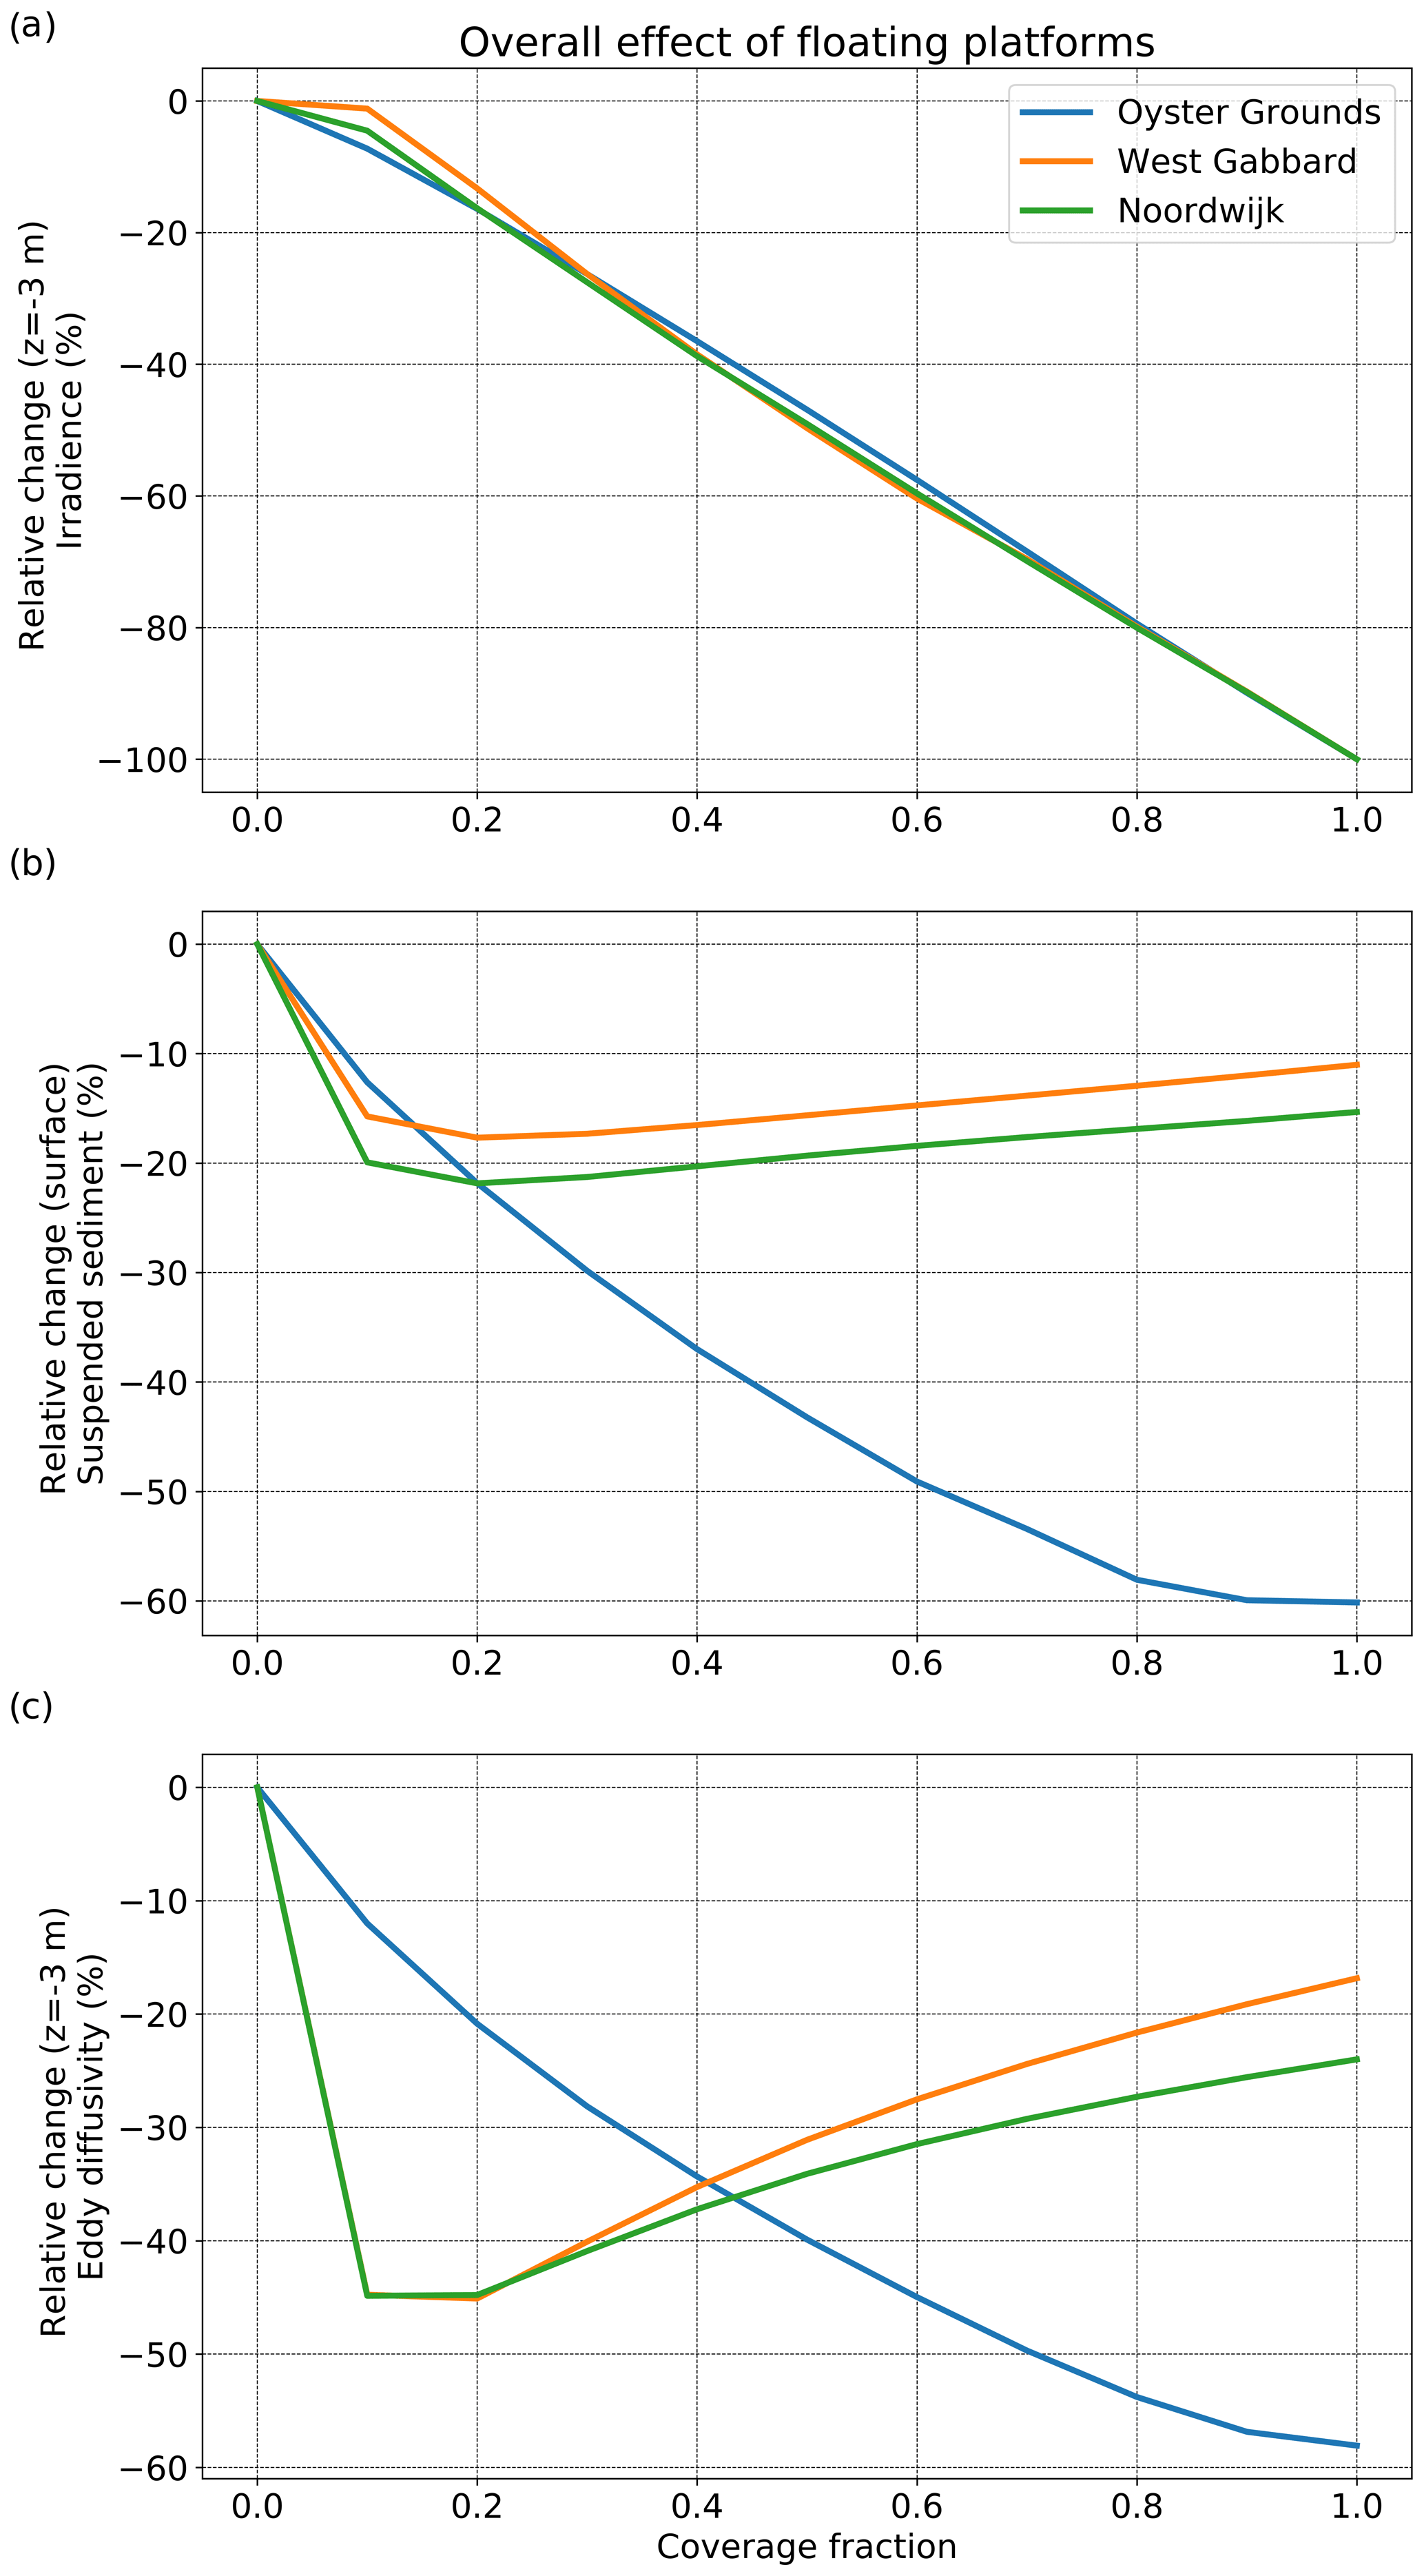
Figure 5Relative change against the reference of (a) irradiance at 3 m depth, (b) suspended sediment at the surface and (c) eddy diffusivity at 3 m depth. The results are presented for increasing values of coverage under the overall effect of floating platforms for the three locations of the experiment.
The resilience of the well-mixed locations for small percentages of coverage with floating platforms can be explained by the migration of their spring bloom towards the sunnier summer months (Fig. 4) and by the compensating effect of decreased surface suspended sediment (Fig. 5b) on irradiance (Fig. 5a). In contrast, the timing of the spring bloom at the stratified location of Oyster Grounds, which is known to coincide with the onset of stratification (Ruardij et al., 1997), did not change substantially for coverage up to at least 60 % (Fig. 4c).
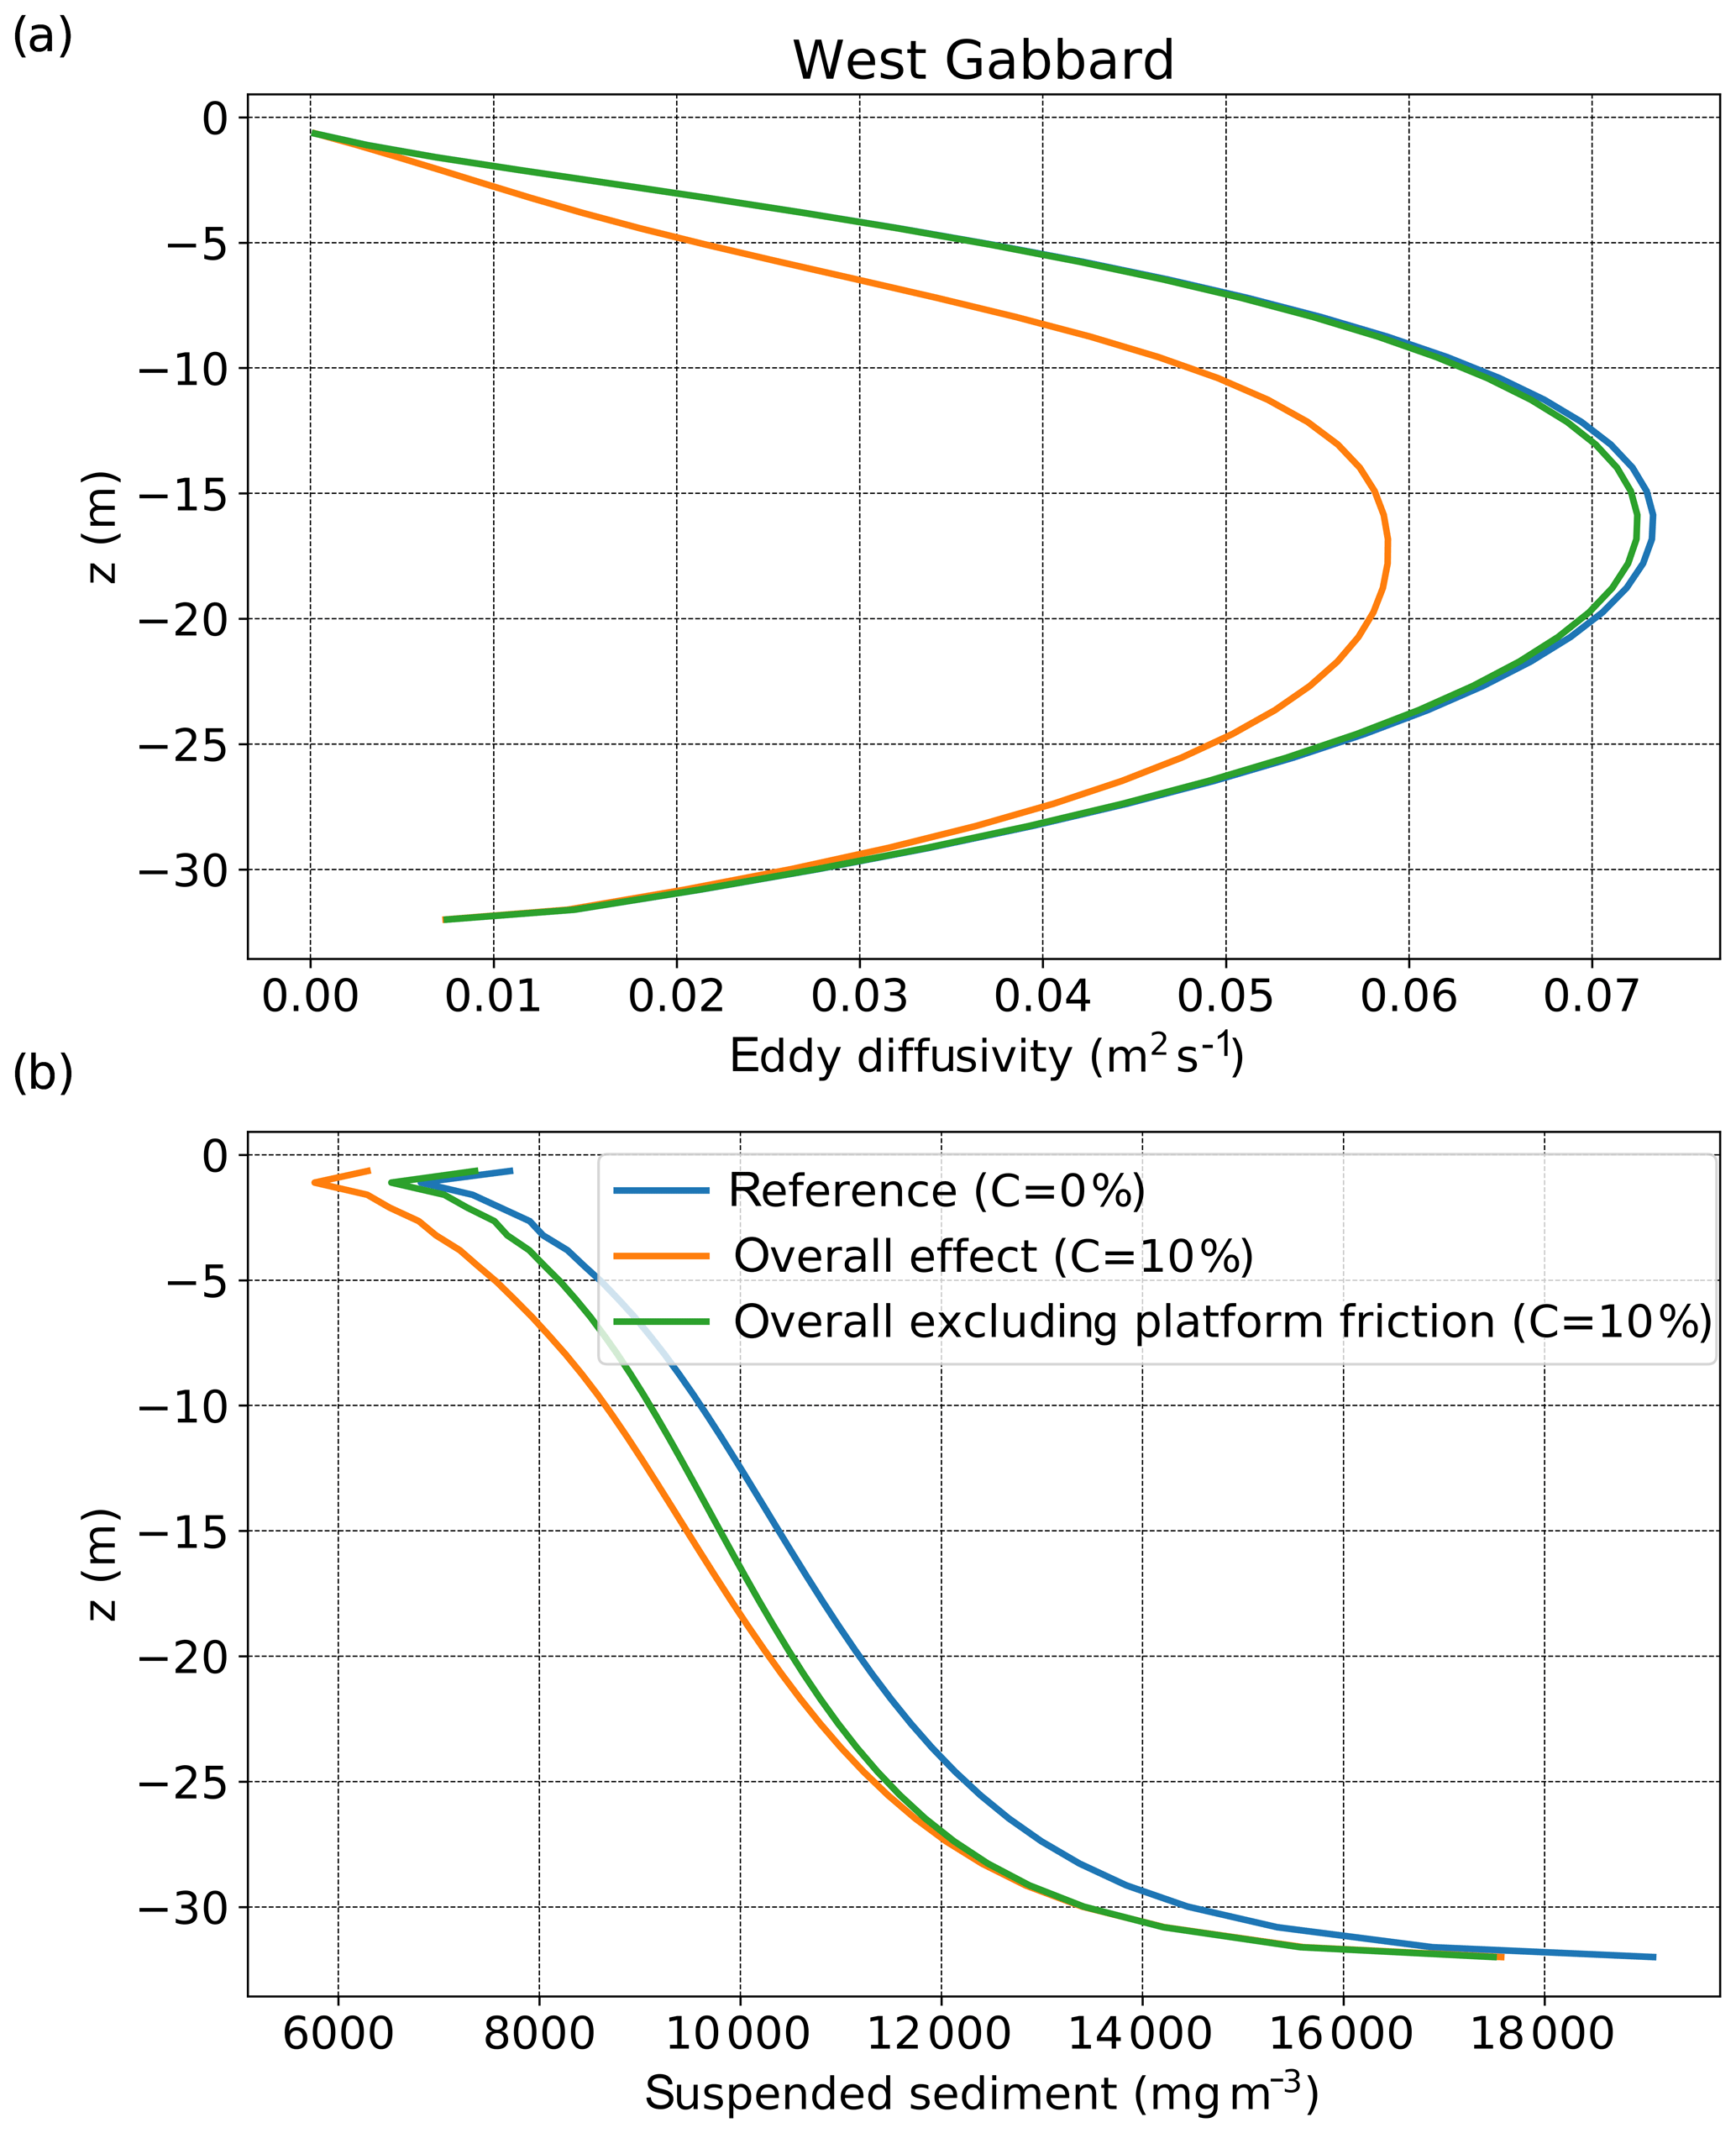
Figure 6Vertical profiles of (a) eddy diffusivity and (b) suspended sediment concentration (averaged over 1998–2008) for the location of West Gabbard. The results are presented for the reference scenario (coverage of 0 %) and for 10 % coverage under the overall effect and the overall effect excluding platform friction.
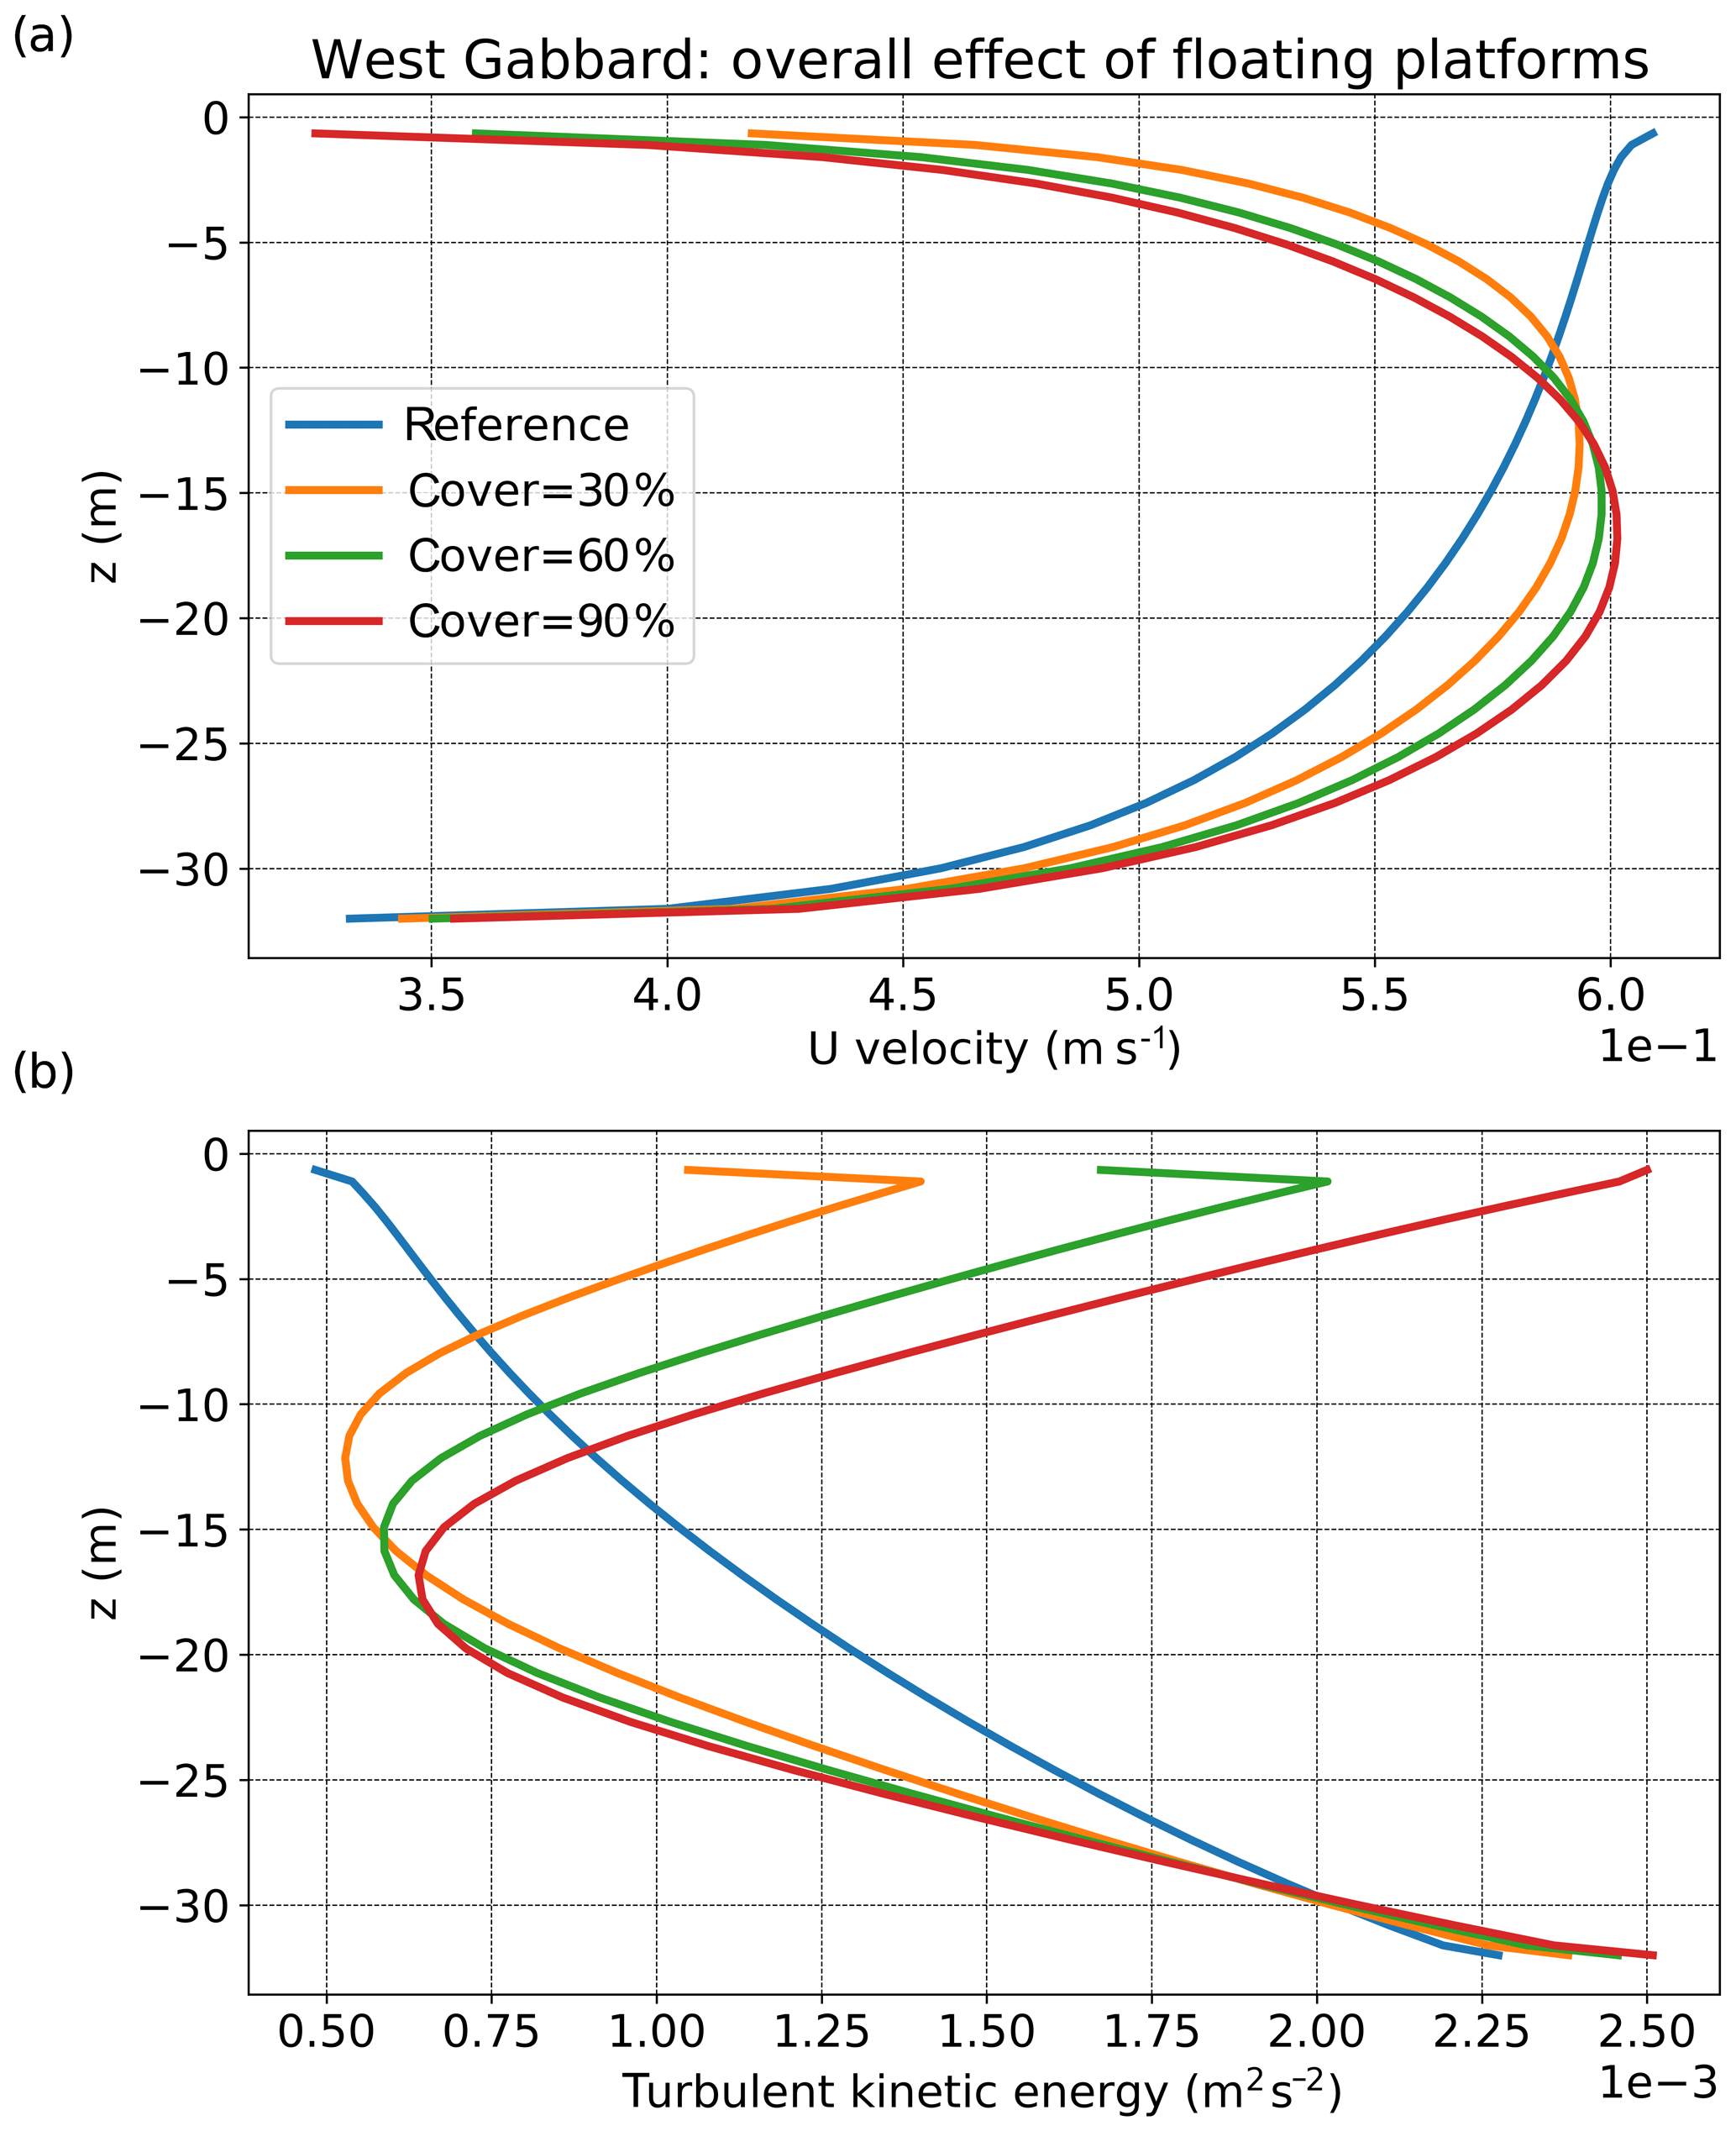
Figure 7(a) Vertical profiles of velocity and (b) turbulent kinetic energy (averaged over 1998–2008) for the location of West Gabbard. The results are presented for different scenarios of coverage under the overall effect of floating platforms.
Considering irradiance near the surface (Fig. 5a), for small percentages of coverage, a weaker reduction of subsurface irradiance occurred at the two well-mixed locations in response to a stronger reduction of suspended sediment at the surface (Fig. 5b), which allowed more light to penetrate the water column. The change in surface suspended sediment concentration with coverage followed the behaviour of subsurface eddy diffusivity (Fig. 5c) in accordance with theory, as lower values of eddy diffusivity result in less upward mixing of suspended sediment (Burchard et al., 1999). For the two well-mixed locations, the change in eddy diffusivity and subsequently in suspended sediment near the surface, was caused mainly by the effect of friction of the platforms on the currents (Fig. 6a, b). Figures 6 and 7 illustrate the above for West Gabbard, while the response of Noordwijk-10 was similar. For 10 % of coverage, eddy diffusivity decreased strongly due to platform friction (Fig. 6a). This led to a decrease of suspended sediment in the upper water column (Fig. 6b). Platform friction reduced velocity near the surface (Fig. 7a). However, the effect near the bottom was minor, leading to no significant effect on suspension of sediment. On the other hand, the change in the shape of the velocity profile resulted in small (or zero) vertical gradients of velocity at mid-depths and large vertical gradients of velocity near the surface (Fig. 7a). This led to an increase of shear production (and thus turbulent kinetic energy) near the surface and a decrease at mid-depths (Fig. 7b), affecting eddy diffusivity and suspended sediment concentration (eddy diffusivity is proportional to the second power of turbulent kinetic energy). According to Fig. 7b, the depth of the layer of increasing turbulence increased with coverage. Thus, the subsurface layers experienced a strong decrease in eddy diffusivity for low percentages of coverage, while further increase of coverage led to increasing values of eddy diffusivity (Fig. 5c). For the Oyster Grounds location, where tidal currents are weaker, the effect of wind shielding was more important. There, the reduction of wind forcing resulted in a gradual decrease of turbulence and eddy diffusivity over the whole water column.
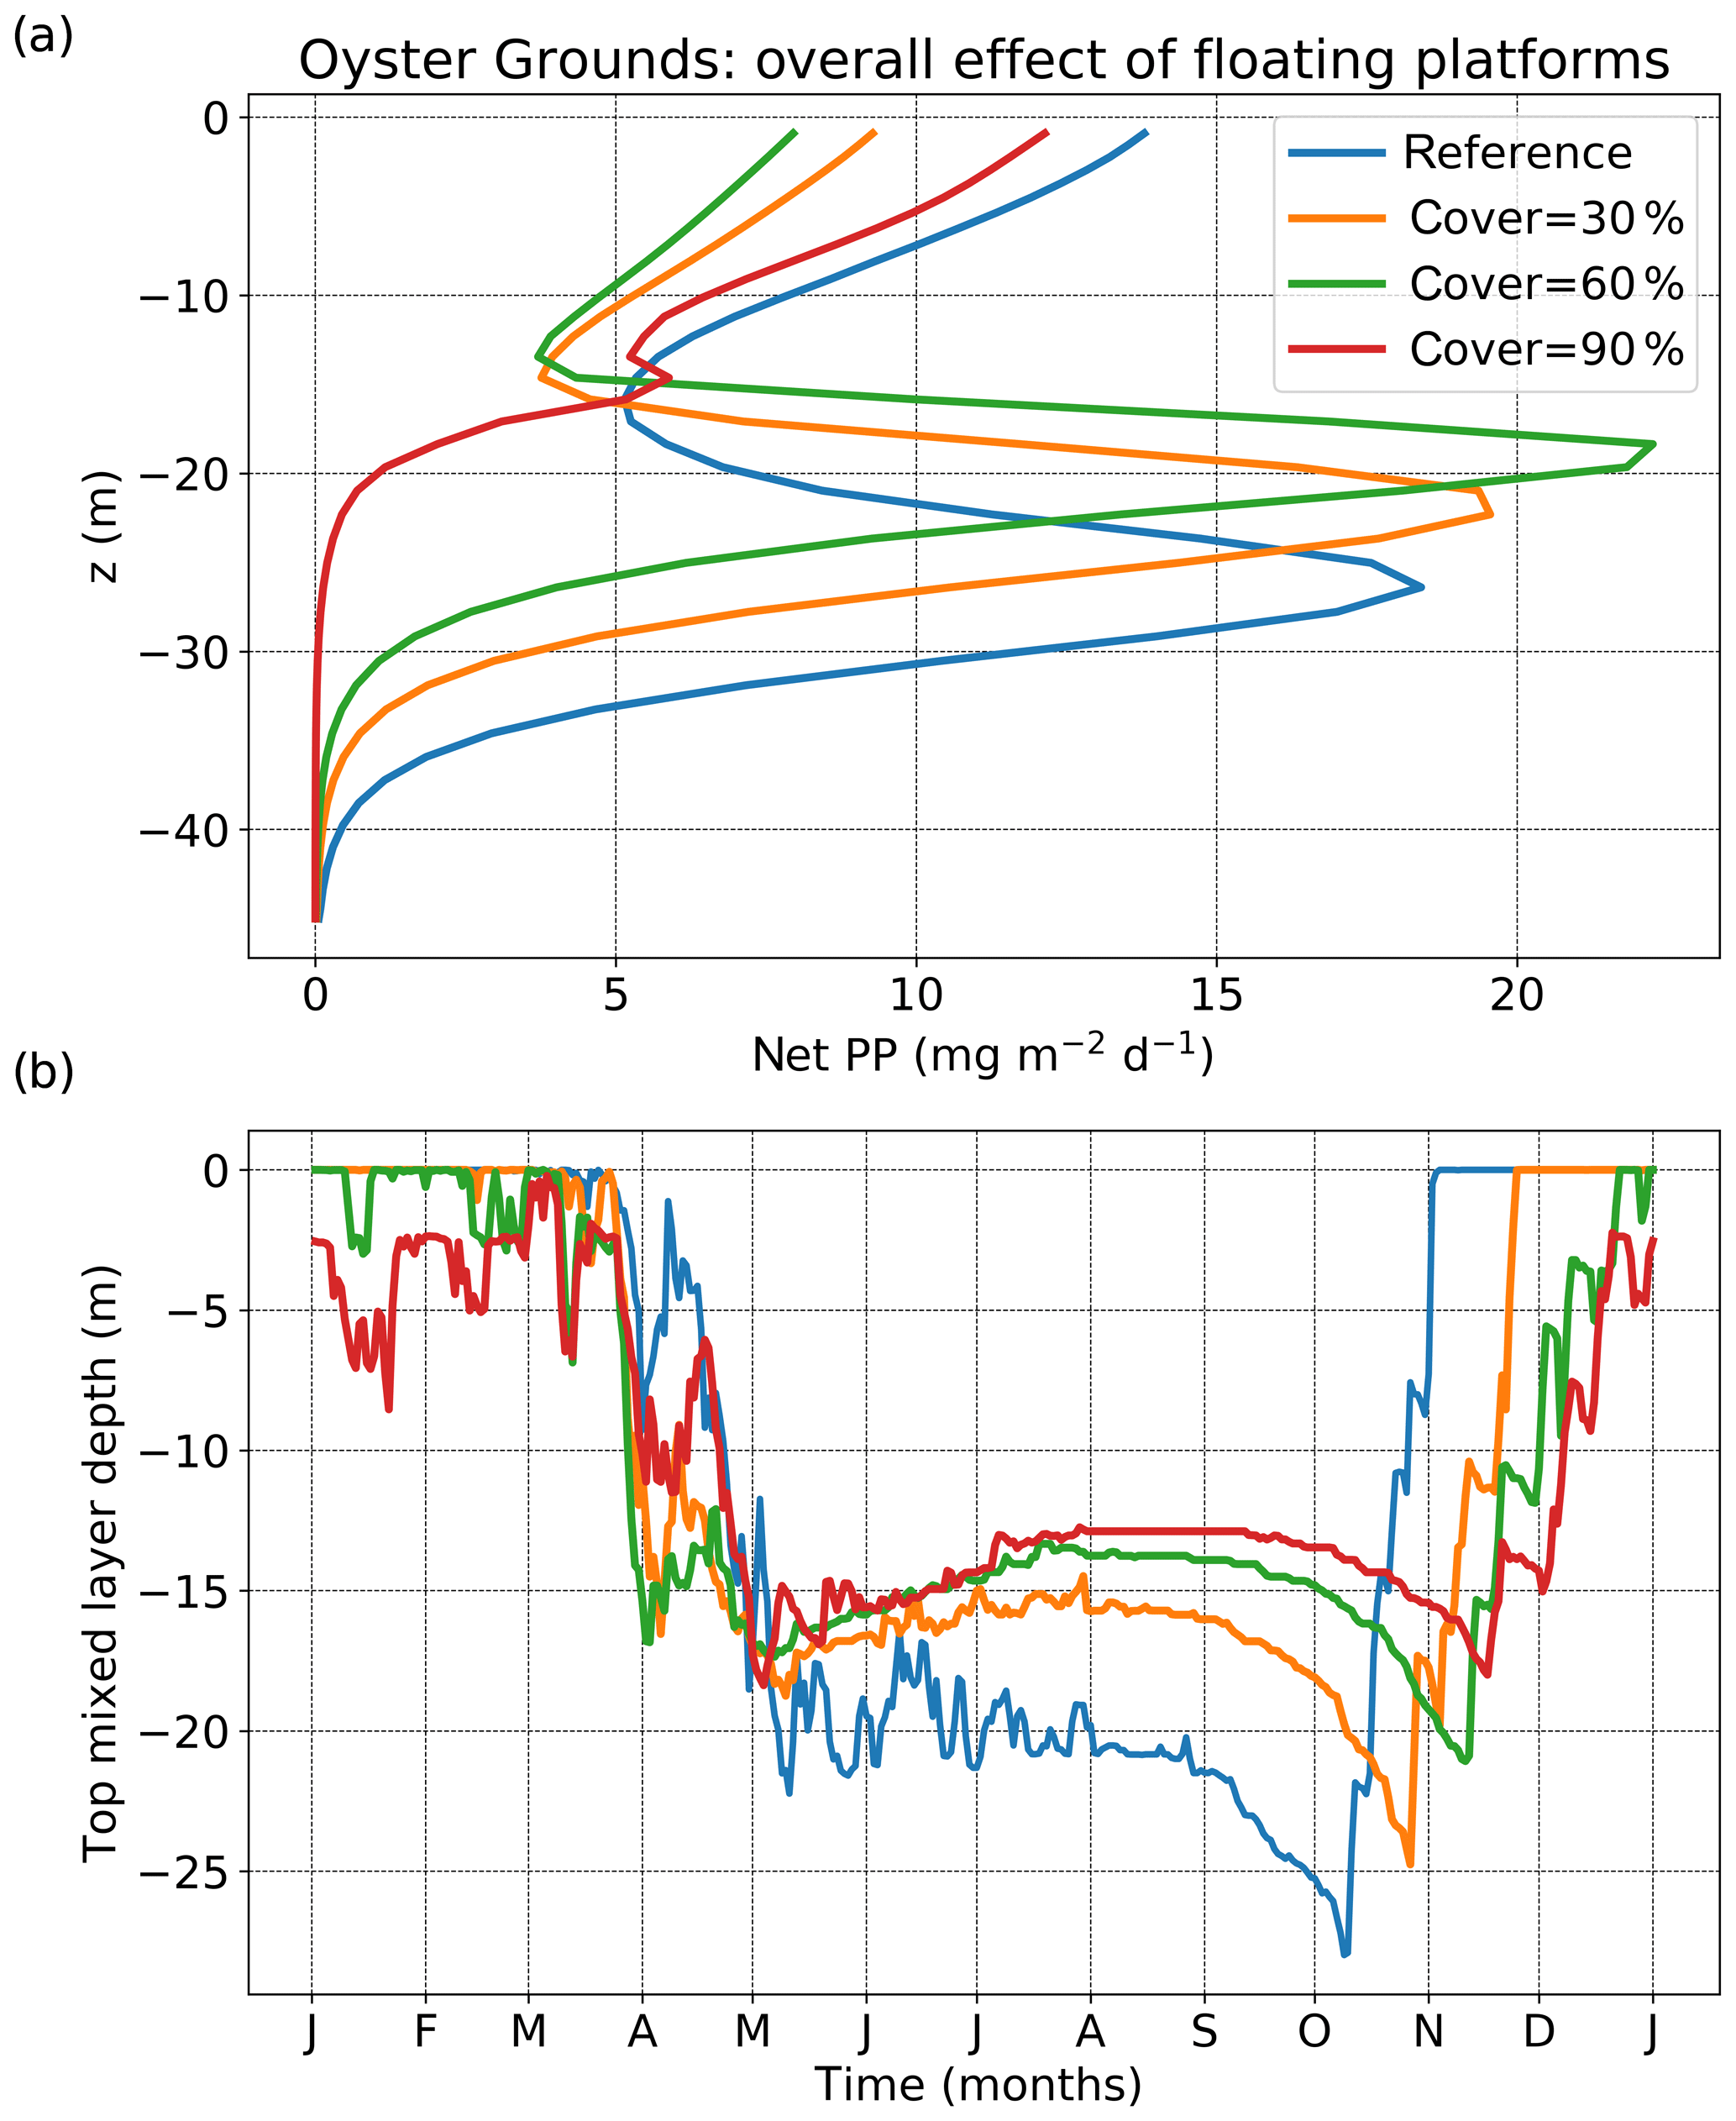
Figure 8Vertical profiles of (a) net primary production and (b) yearly time series of top mixed layer depth (averaged over 1998–2008) for the location of Oyster Grounds. The results are presented for different scenarios of coverage under the overall effect of floating platforms.
The later strong decline of primary production for high percentages of coverage at the Oyster Grounds location can be explained by the effect of the platforms on stratification. Figure 8 shows the time-averaged vertical profile of net primary production (a) and the yearly time series of surface mixed layer depth (the depth where turbulent kinetic energy becomes lower than 10−5 m2 s−2) (b), for different percentages of coverage. The reduction of the depth of the surface mixed layer with coverage (Fig. 8b) that followed the reduced mixing due to wind shielding, resulted in upward displacement of the net primary production maximum that is located below the surface mixed layer (Fig. 8a). Due to its shift towards the surface and hence towards the light, the subsurface maximum of time-averaged net primary production increased, as the effect of the upwards shift outweighed the light deficit induced by the platforms. A reduction of time-averaged net primary production occurred within the surface mixed layer (Fig. 8a), as a thinner layer holds fewer nutrients. Above 60 % of coverage, insufficient light reached the thermocline in summer and the net primary production maximum observed at the stratified location of Oyster Grounds disappeared. The collapse of the net primary production maximum was accompanied by an increase of net primary production within the surface mixed layer, observed even for 90 % of coverage with floating platforms. This explains the later strong decline in primary production for this location.
3.2.2 Contributions to changes in net primary production by separate processes
To compare the importance of the individual effects of the floating platforms (platform-induced light deficit, wind shielding, platform friction) (research question 2), the response of net primary production to the different effects is presented in Fig. 9. The light deficit was the dominant factor for all three locations. For the two well-mixed locations (Fig. 9a and b), platform friction increased primary productivity, resulting in an overall effect that was smaller than the individual effect of the light deficit. In contrast, for Oyster Grounds, the impact of the light deficit effect was enhanced in particular by wind shielding (Fig. 9c). Reduced mixing resulting from wind shielding, which by itself would result in an earlier onset of stratification, balanced the effect of the light deficit (decreased buoyancy input) which by itself would result in a later onset of stratification and spring bloom. It thus prevented the partly compensating effect of a later spring bloom on net primary production that occurred at the well-mixed sites where stratification did not occur and where therefore wind shielding could not have much effect on the timing of the spring bloom.
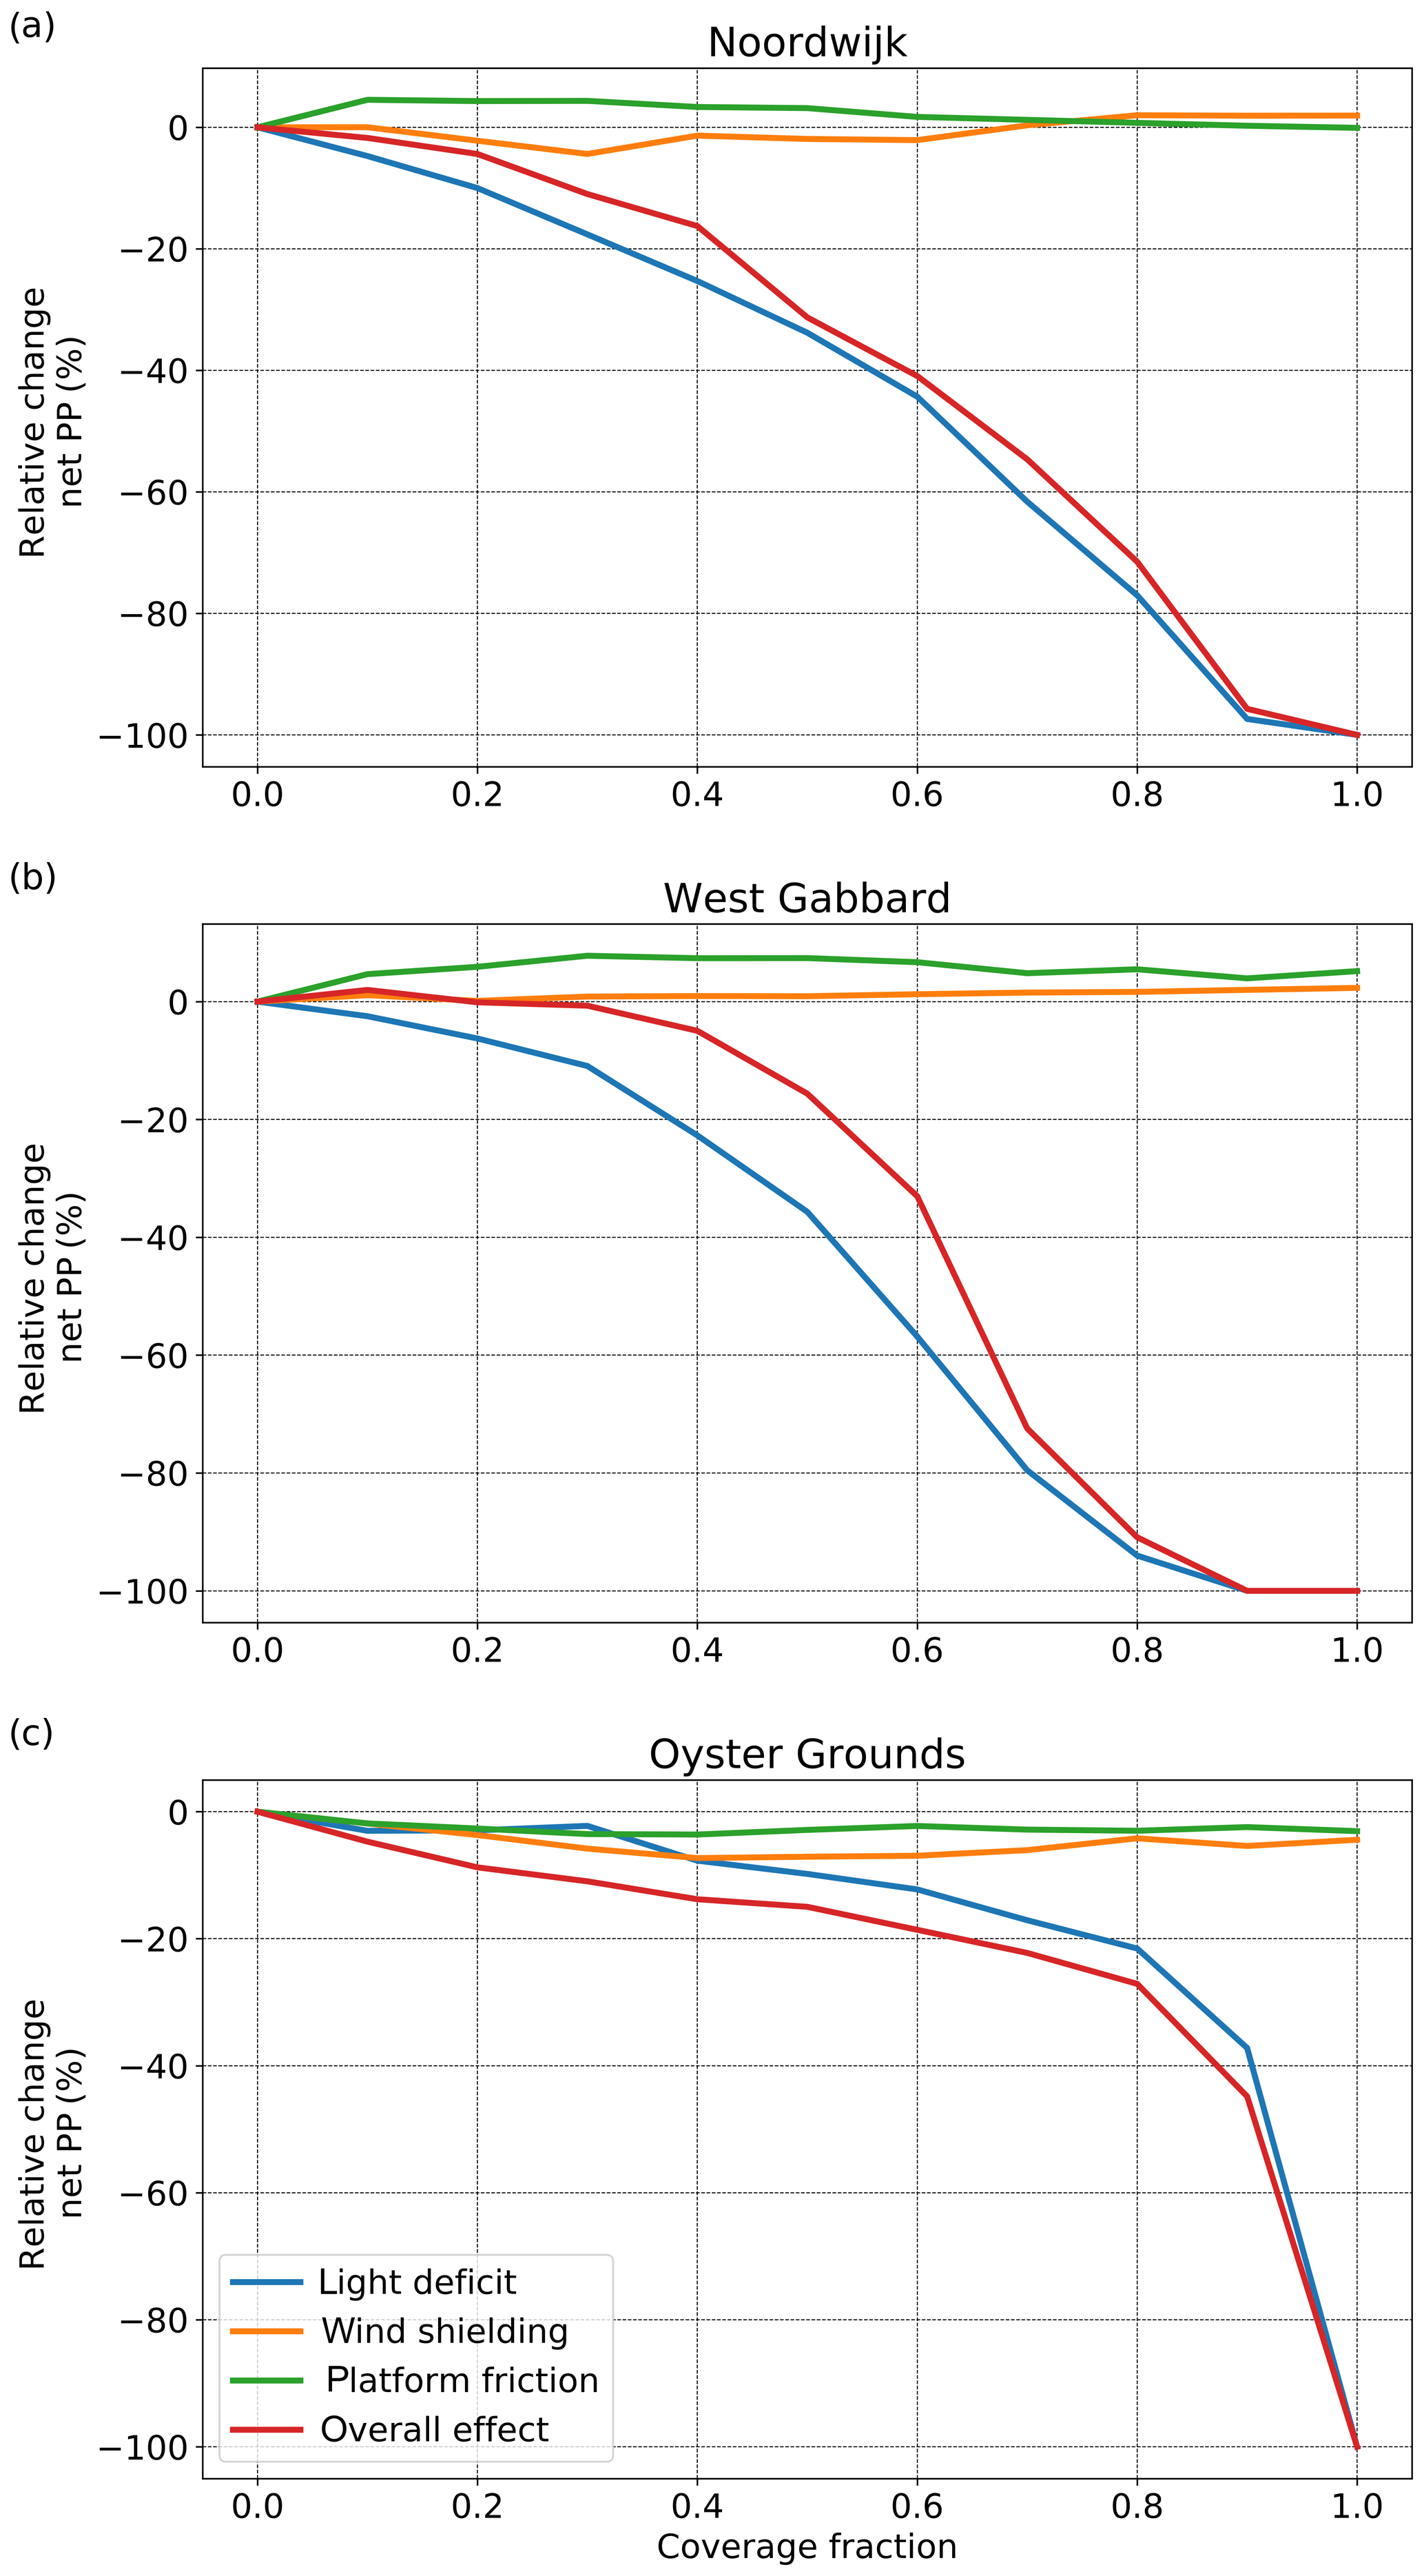
Figure 9Relative change against the reference of net primary production with coverage for the three locations of the experiment under the different effects as a function of coverage with floating platforms.
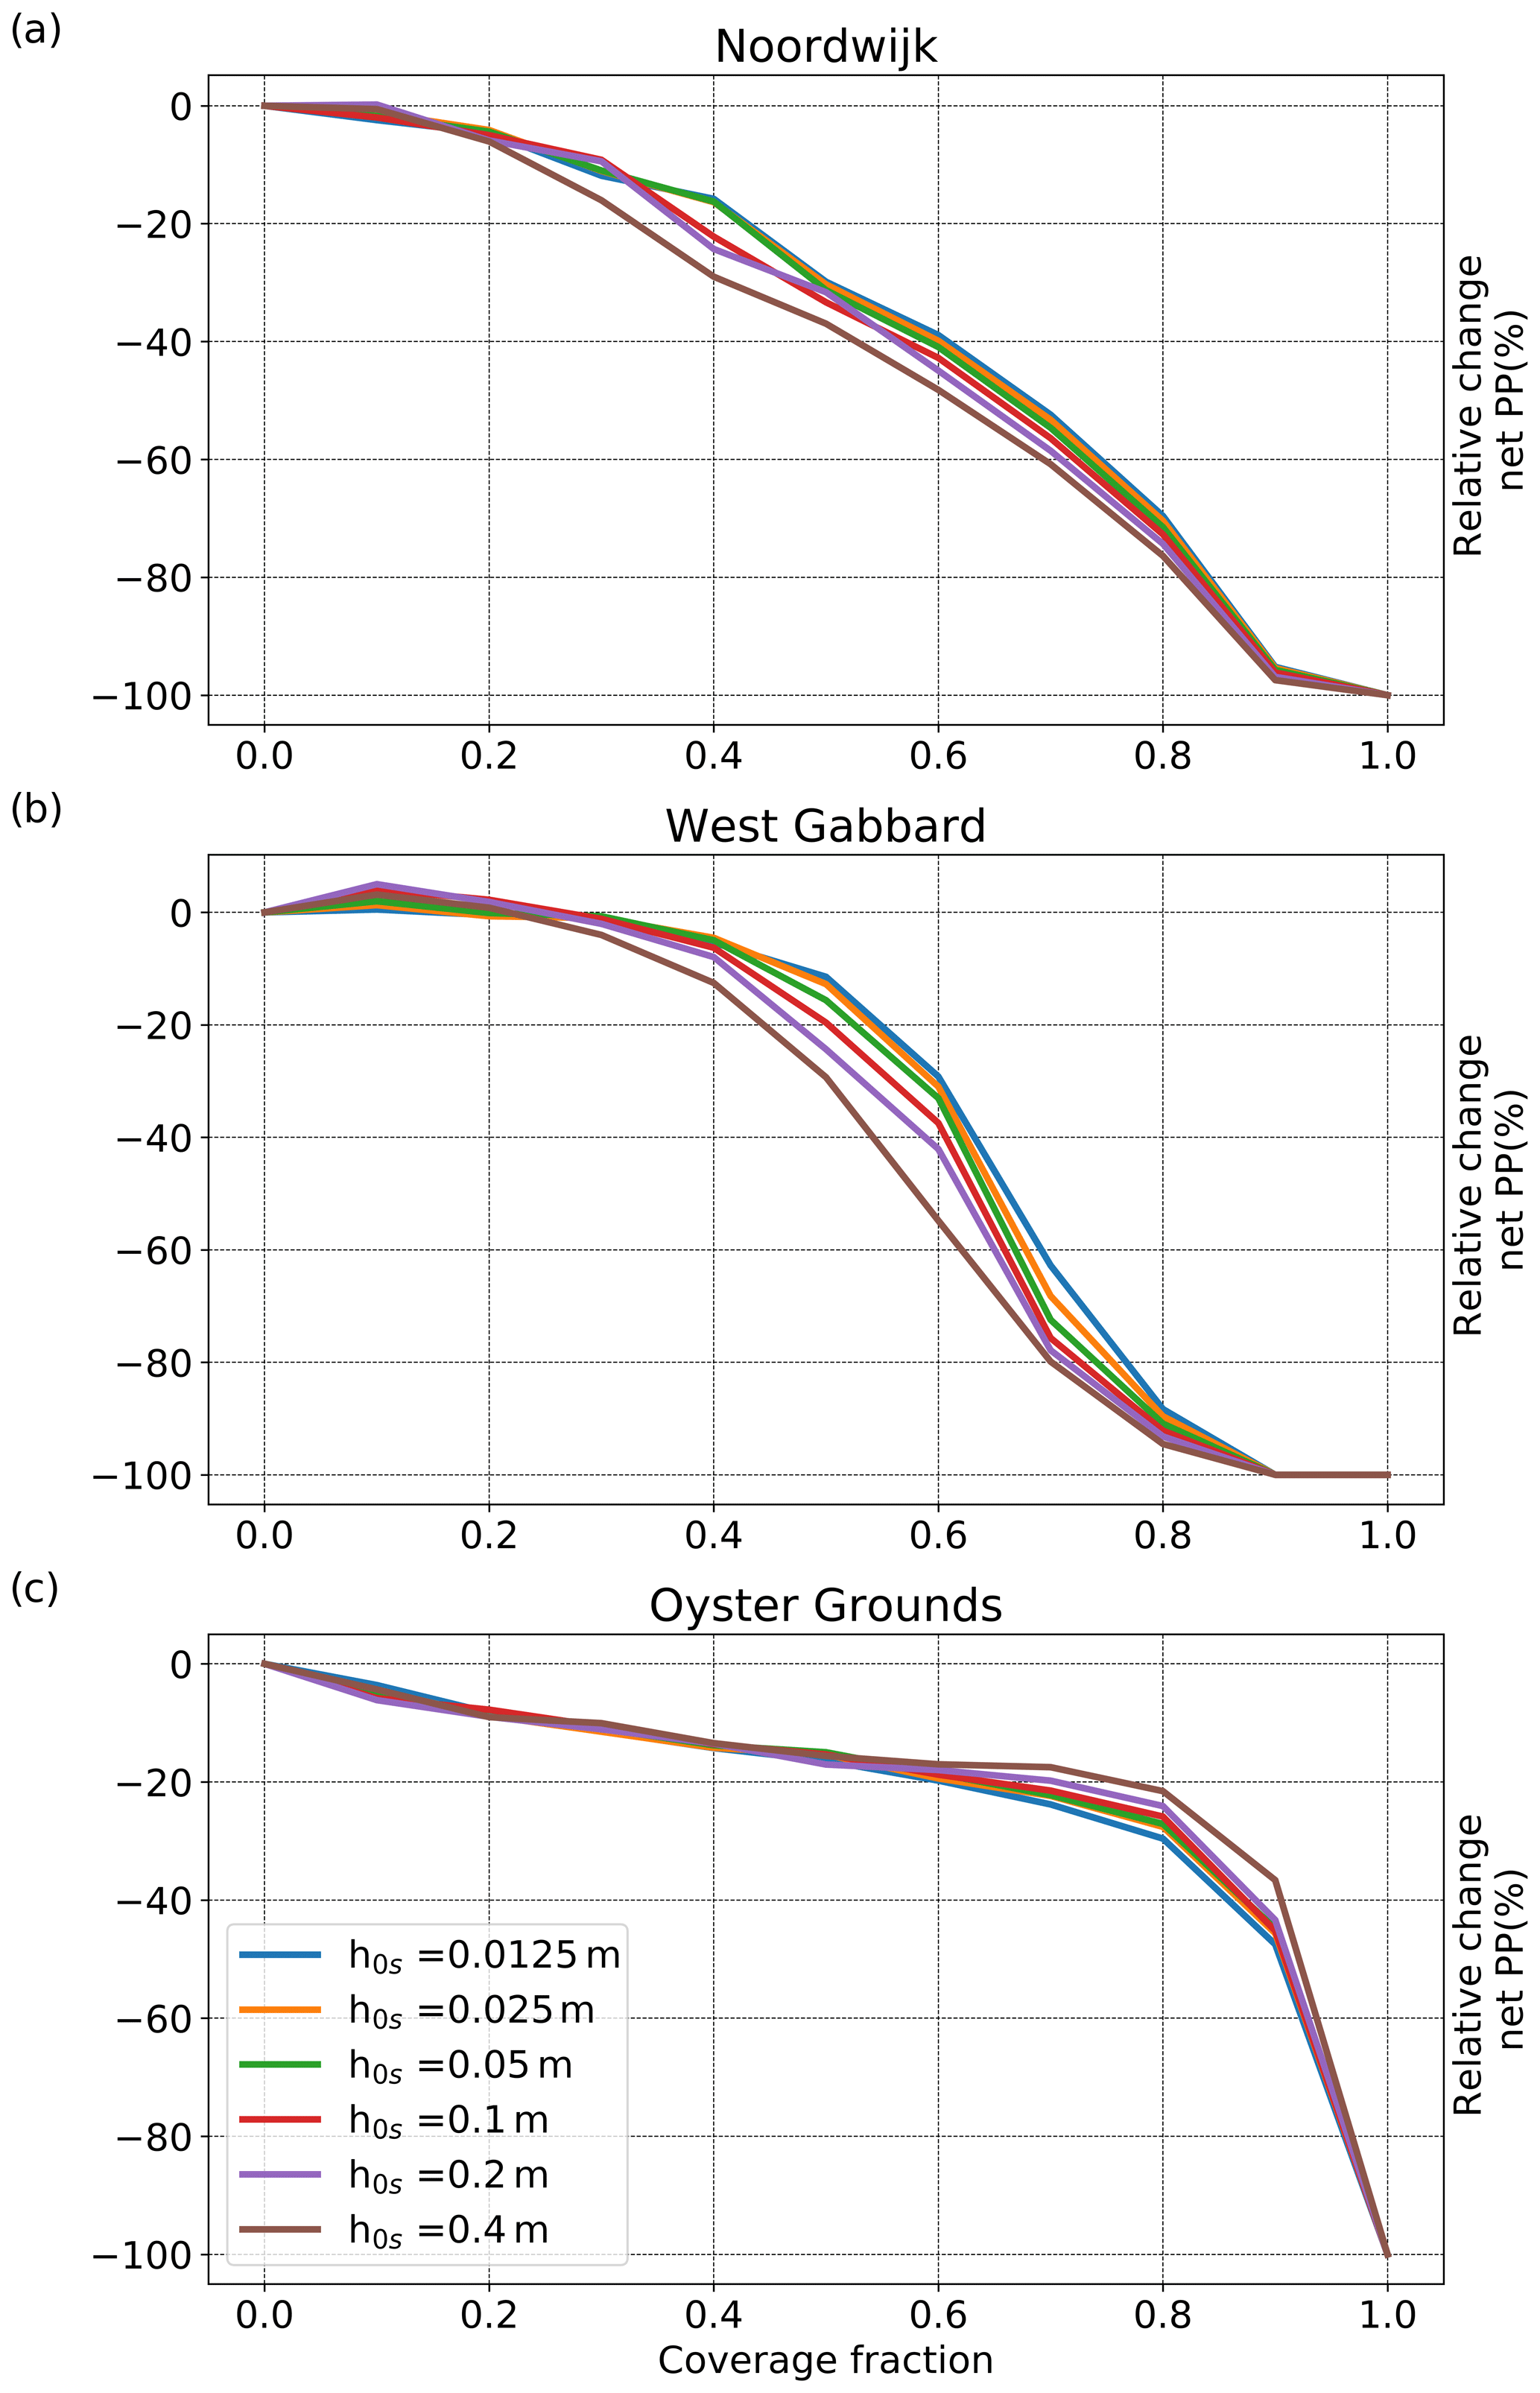
Figure 10Relative change against the reference of net primary production with coverage for the three locations of the experiment and different values of roughness height of the platforms (h0s).
3.2.3 Roughness of the platforms
To assess the uncertainty introduced by the assumed value of the roughness height of the platforms (h0s=0.05 m) and to evaluate the potential importance of the platform design and maintenance, model runs were conducted for different values of h0s. For coverage up to 20 %, the difference was small for all sites (Fig. 10). At the well-mixed sites (Fig. 10a, b), for higher levels of coverage (>40 %), the range of values of platform roughness showed a spread in the impact of the floating platforms on the net primary production, equivalent to a difference of approximately 10 % in coverage, by modifying the eddy diffusivity, and thus the suspended sediment concentration near the surface. For the Oyster Grounds location (Fig. 10c) and coverage levels higher than 60 %, the increase in roughness height compensated the impact of the installations on net primary production to some extent. This compensating effect for high values of the roughness height on net primary production is not fully understood but may be related to the deeper surface mixed layer under higher values of roughness height.
The direct and indirect effects of floating platforms on net primary production have been analysed for three contrasting locations in the North Sea using a water column model, showing overall reductions for increasing levels of coverage. Three response regimes were identified. In regime 1 (less than approximately 20 % coverage), the three locations were relatively resilient to the presence of the platforms, and the reduction of net primary production was relatively small (less then 10 %). This seems to be a relatively robust response that can possibly be extrapolated to other sites in the North Sea. In regime 2 (approximately 20 %–40 % coverage), a substantial spread in the results occurred between the sites. Thus, no general site-independent conclusions can be drawn. In regime 3 (more than approximately 40 % coverage), all three curves sloped down rapidly, albeit at different levels of coverage. This again is a similar and robust response indicating serious disruption of the ecosystem, ultimately leading to a full collapse.
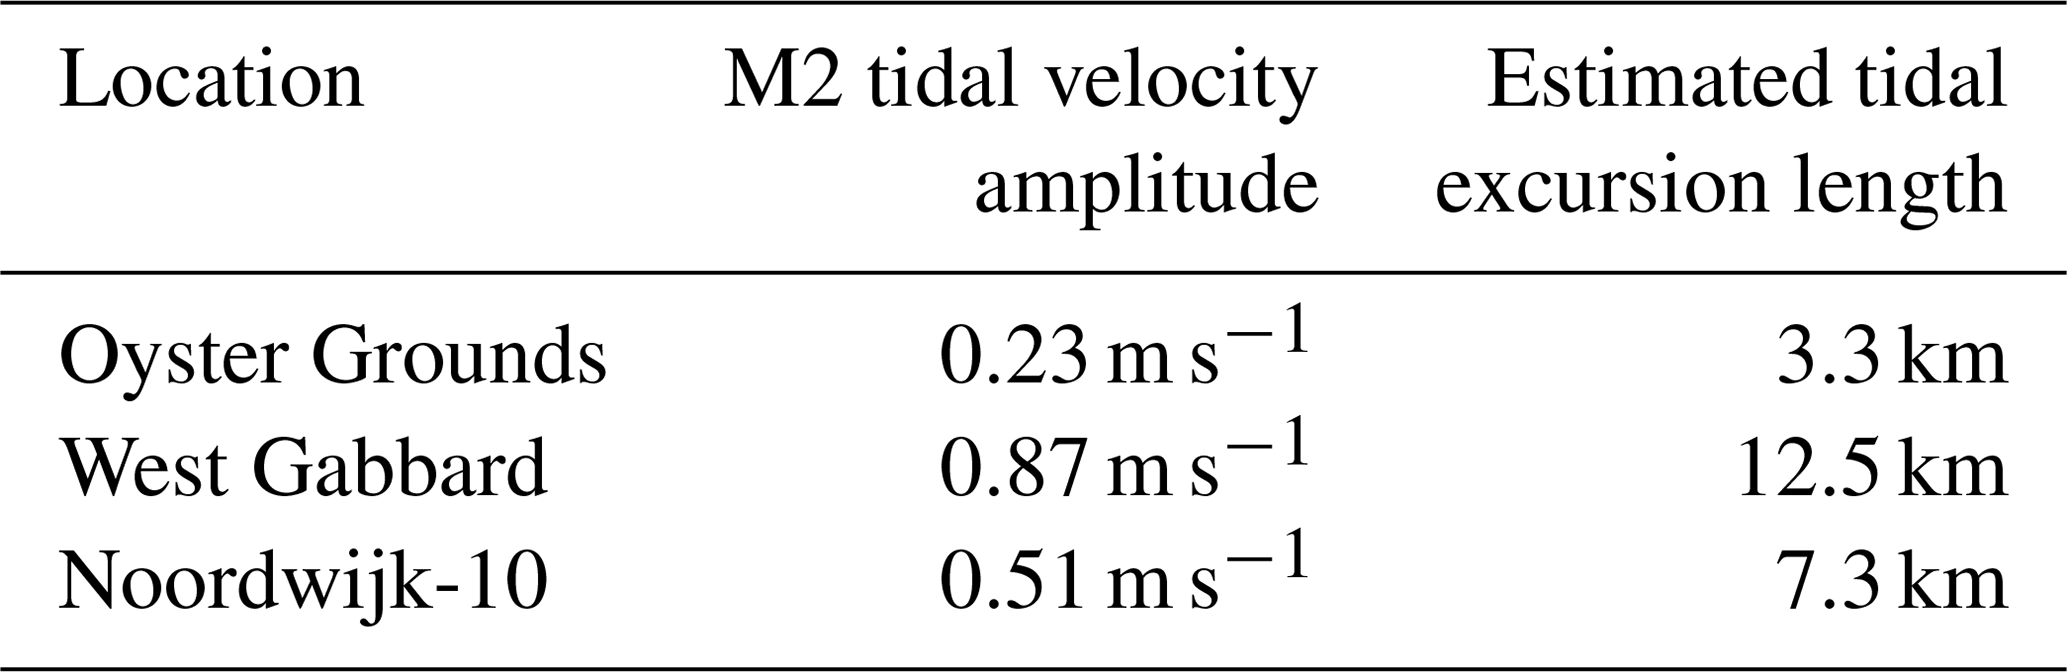
The water column model assumes a “unit” horizontal extent and spatial homogeneity, not only in terms of the oceanographic and biogeochemical properties but also in terms of coverage with floating platforms. As the spatial homogeneity assumption implies having the same conditions into infinity, it is not immediately clear how the water column model results can be related to solar PV farms of a finite extent. We can, however, provide a rough estimate of a minimum spatial scale needed to start to approximate spatial homogeneity. To obtain equivalent (changes in) primary production conditions as simulated by the water column model, phytoplankton, which are transported by the tides, would need to spend a significant amount of time underneath a farm of a certain size (longer than they can chemically buffer solar energy photosynthesised before they were advected into or out of the farm area). Hence, as tides generate the dominant currents in the North Sea, we could take the tidal excursion length as a measure of minimum horizontal size corresponding to the conditions simulated by the water column model: if a farm is smaller, it does not conform to the spatial homogeneity assumption of the model because individual phytoplankton cells would be advected into and out of the farm on a timescale of hours. Considering the M2 harmonic constituent as the dominant tidal component, taking the tidal current amplitudes at the three locations from a three-dimensional model, and integrating over half a tidal cycle (6.25 h), the estimated tidal excursion lengths are 3.3 km for Oyster Grounds, 7.3 km for Noordwijk-10 and 12.5 km for West Gabbard (Table 4). For solar PV farms smaller than this length scale, the modelled reductions in net primary production presented here may be overestimates, and simulations with spatially resolved models are needed to obtain more accurate results. A similar argument holds if substantial residual currents are present in addition to tides. We also note that the results presented here are based on the assumption that platforms are distributed homogeneously in space. Estimates of potential modulations of the current results that may be induced by inhomogeneous distributions of platforms in space can only be made with spatially resolved models.
Table 4M2 tidal velocity amplitudes, estimated tidal excursion length as the minimum length scale of farms with floating platforms for which the water column model results are valid.
These first model simulations have ignored a number of physical and biological processes that should be considered in further work. The implementation of PV coverage with a 1-DV model does not allow for a realistic representation of the spatial configuration of a solar power plant, the characteristics of which (e.g. the distance between platforms, service lanes) could result in a different response of the ecosystem, as they would influence the horizontal light diffusion below the platforms and the development of the surface boundary layer from friction with the platforms. Moreover, wave–platform interactions and their effects on the mixing of the water column and the resuspension of sediment have been ignored in this study and may well depend on platform dimensions. To account for these processes in further work, simulations with three-dimensional (3-D) models are needed. Also, additional ecosystem components could be considered in a three-dimensional model, such as Phaeocystis in areas with high nutrient loads, and growth of hard-substrate flora and fauna on the platforms. It may also be possible that there are effects on atmospheric properties (effect of platforms on the wind) and air–sea gas exchange.
We used three contrasting and relatively data-rich locations in the North Sea for this first study to illustrate the effects of floating platforms on net primary production. The differences in the response between the sites indicate that studying new locations will add valuable information. The study focused on the response of the marine (eco)system to floating platforms in terms of water column structure and net primary production, but other quantities with indicator qualities should also be considered in further work, such as changes in sediment transport, disturbance of the balance of organisms and the integrity of the seabed in terms of biomass, species composition and biogeochemical functioning. A good next step would be an examination of the effects of floating platforms with a local high-resolution 3-D model. The water column model as presented here can, despite its limitations, be used as a test bed to support further work.
This first study was carried out as an exploratory investigation of potential effects and mechanisms, and has elucidated the principle response of the ecosystem. Extreme care should, however, be taken to use the results for specific planning purposes, and in principle further investigations should be carried out for specific cases. However, as a rough rule of thumb, in absence of better data/models/knowledge, adopting the precautionary principle and disregarding other effects and criteria that were not considered here (e.g. ecosystem variables other than net primary production, impact on waves, impact of biofouling on the biogeochemistry, specific spatial distribution of floating structures within a farm, acceptable levels of impact, political and planning considerations), we recommend that real-world field implementations of floating infrastructure in the marine environment should not enter regimes 2 (too uncertain) and 3 (significant disturbance). This implies that, according to our results, coverage density should not exceed approximately 20 % for farms of a size on the order of magnitude of the local tidal excursion length or larger. We also advise that, for general and individual cases, “acceptable” levels of impact are defined and motivated, and further work is carried out to improve understanding of environmental effects of floating (solar PV) platforms or any other large floating infrastructure in the marine environment such as large-scale seaweed farming, in general and for specific cases.
The incident radiation with floating structures is given by
with I0 the incident radiation without platforms and C the coverage fraction of a number between 0 and 1. The surface wind stress with floating structures, assuming that the platforms do not affect the wind speed, is given by
with τw the surface wind stress vector without platforms. This wind stress is applied as a flux boundary condition. The surface shear stress (normalised with density) by floating structures, according to the logarithmic law of wall, and assuming that the platforms are large compared with the development distance of the platform boundary layer, is given by
Here, u is the velocity vector in the surface cell at h/2 below the surface, resulting from the numerical integration in GOTM, and rs is the surface drag coefficient of the floating structures. This friction shear stress is applied as a sink term in the momentum equations. To include the contribution by molecular viscosity to the surface roughness of the structures, the drag coefficient rs is calculated assuming a logarithmic velocity profile in analogy to the implementation of bottom friction in GOTM. This is done by iteratively solving the equations for rs, the frictional velocity at the underside of the floating structures u*s, and the surface roughness length z0s, given the velocity vector in the surface grid cell u. The equations for rs, u*s and z0s are
where κ is the Von Kármán constant and h the height of the surface cell,
and
where (m2 s−1) is the molecular (kinematic) viscosity, h0s the mean height of the roughness elements at the bottom of the platform and u*s the magnitude of the frictional velocity. The scalar factors are from Burchard et al. (1999).
The radiation at different depths of the water column is given by
where is the incident radiation, h the water depth, z the height above bed and kd the total extinction coefficient, due to scattering and absorption processes, and is given by
with kd,w, kd,cdom, kd,spm, kd,chl and kd,det the extinction coefficients due to clear water, coloured dissolved organic matter, (mineral) suspended sediment, chlorophyll and detritus, respectively.
Stand-alone code for GOTM can be downloaded from https://github.com/gotm-model/code.git (last access: 22 January 2020). For installation instructions, see https://gotm.net/portfolio/software (last access: 22 January 2020). GOTM initially developed by Burchard et al. (1999), and further developed by a group of volunteers for over 20 years; see https://gotm.net/publications (last access: 22 January 2020) for references.
SmartBuoy data are available from Cefas; see http://data.cefas.co.uk/#/View/66 (Cefas, 2020) for details.
TK did this work as an MSc student at Utrecht University. BV initiated the study. JvdM formulated and planned the project.
Brigitte Vlaswinkel is the research director of Oceans of Energy, a commercial company that develops offshore solar power arrays. The interests of Oceans of Energy include aims to not exceed acceptable impacts on the environment, and commercial interests have not played a role in the study. The other authors declare that they have no conflict of interest.
Naomi Greenwood (Cefas) kindly provided the SmartBuoy observations. Oceans of Energy provided the internship compensation, and NIOZ provided computer resources and an accommodation allowance.
This paper was edited by Oliver Zielinski and reviewed by Fabian Große and three anonymous referees.
Baretta, J., Ebenhof, W., and Ruardij, P.: The European regional seas ecosystem model, a complex marine ecosystem model., Neth. J. Sea Res., 33, 233–246, https://doi.org/10.1016/0077-7579(95)90047-0, 1995. a
Blauw, A., Los, F., Huisman, J., and Paperzak, L.: Nuisance foam events and Phaeocystis globosa blooms in Dutch coastal waters analyzed with fuzzy logic, J. Mar. Syst., 83, 115–126, https://doi.org/10.1016/j.jmarsys.2010.05.003, 2010. a
Burchard, H., Bolding, K., Villarreal, M., Centre, E. C. J. R., and Institute, S. A.: GOTM, a General Ocean Turbulence Model: Theory, Implementation and Test Cases, EUR/European Commission, Space Applications Institute, available at: https://books.google.nl/books?id=zsJUHAAACAAJ (last access: 21 January 2020), 1999. a, b
Burchard, H., Bolding, K., Kuhn, W., Meister, A., Neumann, T., and Umlauf, L.: Description of a flexible and extendable physical–biogeochemical model system for the water column, J. Mar. Syst., 61, 180–211, https://doi.org/10.1016/j.jmarsys.2005.04.011, 2006. a, b
Cefas: SmartBuoy Marine Observational Network, available at: http://data.cefas.co.uk/#/View/66, last access: 21 January 2020. a
da Silva, G. and Branco, D.: Is floating photovoltaic better than conventional photovoltaic? Assessing environmental impacts, Impact Assessment and Project Appraisal, https://doi.org/10.1080/14615517.2018.1477498, 2018. a, b
de Kok, J. M., de Valk, C., van Kester, T. M., de Goede, E., and Uittenbogaard, R. E.: Salinity and Temperature Stratification in the Rhine Plume, Estuarine, Coast. Shelf Sci., 53, 467–475, https://doi.org/10.1006/ecss.2000.0627, 2001. a
Grech, M., Stagno, L., and Aquilina, M.: Floating photovolataic installations in Maltese Sea waters, in: 32nd European Photovoltaic Solar Energy Conference and Exhibition, 1964–1968, https://doi.org/10.4229/EUPVSEC20162016-5BV.2.35, 2016. a
Otto, L., Zimmermann, J., Furnes, G., Mork, M., Saetre, S., and Becker, G.: Review of Physical Oceanography of the North Sea, Neth. J. Sea Res., 26, 161–238, https://doi.org/10.1016/0077-7579(90)90091-T, 1990. a
Pickering, M., Wells, N., Horsburgh, K., and Green, J.: The impact of future sea-level rise on the European Shelf tides, Cont. Shelf Res., 35, 1–15, https://doi.org/10.1016/j.csr.2011.11.011, 2012. a
Ruardij, P., van Haren, H., and Ridderinkhof, H.: The impact of thermal stratification on phytoplankton and nutrient dynamics in shelf seas: a model study, J. Sea Res., 38, 311–331, https://doi.org/10.1016/S1385-1101(97)00042-7, 1997. a, b, c
Sahu, A., Yadavb, N., and Sudhakarc, K.: Floating photovoltaic power plant: A review, Renew. Sust. Energ. Rev., 66, 815–824, https://doi.org/10.1016/j.rser.2016.08.051, 2016. a
Santafe, M., Bautista, J., Soler, T., Javier, F., Romero, S., Pablo, S., Gisbert, F., Javier, J., Gozálvez, F., Carlos, M., and Gisbert, F.: Theoretical and experimental analysis of a floating photovoltaic cover for water irrigation reservoirs, Energy, 67, 246–255, https://doi.org/10.1016/j.energy.2014.01.083, 2014. a
Simpson, J. H., Burchard, H., Fisher, N. R., and Ripper, T. P.: The semi-diurnal cycle of dissipation in a ROFI: model-measurement comparisons, Cont. Shelf Res., 22, 1615–1628, https://doi.org/10.1016/S0278-4343(02)00025-0, 2002. a
Sundermann, J. and Pohlmann, T.: A brief analysis of North Sea physics, Oceanologia, 53, 663–689, https://doi.org/10.5697/oc.53-3.663, 2011. a
Sverdrup, H.: On Conditions for the Vernal Blooming of Phytoplankton, J. Mar. Sci., 18, 287–295, https://doi.org/10.1093/icesjms/18.3.287, 1953. a
Tijssen, S. and Wetsteyn, F.: Hydrographic observations near a subsurface drifter in the Oyster Ground, North Sea, Neth. J. Sea Res., 18, 1–12, https://doi.org 10.1016/0077-7579(84)90021-8, 1984. a
Trapani, K. and Millar, D.: Proposing offshore photovoltaic (PV) technology to the energy mix of the Maltese islands, Energ. Convers. Manage., 67, 18–26, https://doi.org/10.1016/j.enconman.2012.10.022, 2012. a
U.S. Army Corps of Engineers: Shore Protection Manual, Volume I and II, U.S. Army Coastal Engineering Research Center, Vicksburg, Mississippi, USA, 1984. a
van der Molen, J., Smith, H., Lepper, P., Limpenny, S., and Rees, J.: Predicting the large-scale consequences of offshore wind array development on a North Sea ecosystem, Cont. Shelf Res., 85, 60–72, https://doi.org/10.1016/j.csr.2014.05.018, 2014. a
van der Molen, J., Ruardij, P., and Greenwood, N.: Potential environmental impact of tidal energy extraction in the Pentland Firth at large spatial scales: results of a biogeochemical model, Biogeosciences, 13, 2593–2609, https://doi.org/10.5194/bg-13-2593-2016, 2016. a
van der Molen, J., Ruardij, P., and Greenwood, N.: A 3D SPM model for biogeochemical modeling with application to the north- west European continental shelf, J. Sea Res., 127, 63–81, https://doi.org/10.1016/j.seares.2016.12.003, 2017. a, b
van der Molen, J., Ruardij, P., Mooney, K., Kerrison, P., O'Connor, N. E., Gorman, E., Timmermans, K., Wright, S., Kelly, M., Hughes, A. D., and Capuzzo, E.: Modelling potential production of macroalgae farms in UK and Dutch coastal waters, Biogeosciences, 15, 1123–1147, https://doi.org/10.5194/bg-15-1123-2018, 2018. a
van Leeuwen, S., Tett, P., Mills, D., and van der Molen, J.: Stratified and nonstratified areas in the North Sea. Long term variability and biological and policy implications, J. Geophys. Res., 120, 4670–4686, https://doi.org/10.1002/2014JC010485, 2015. a
Vichi, M., Pinardi, N., and Masina, S.: A generalized model of pelagic biogeochemistry for the global ocean ecosystem, J. Mar. Syst., 64, 98–109, 2007. a
Wetsteyn, L. and Kromkamp, J.: Turbidity, nutrients and phytoplankton primary production in the Oosterschelde (The Netherlads) before, during and after a large-scale coastal engineering project (1980–1990), Hydrobiologia, 282, 61–78, https://doi.org/10.1007/BF00024622, 1994. a
- Abstract
- Introduction
- Material and methods
- Results
- Discussion and conclusions
- Appendix A: Mathematical implementation of the floating structures
- Appendix B: Mathematical description of light attenuation
- Code availability
- Data availability
- Author contributions
- Competing interests
- Acknowledgements
- Review statement
- References